
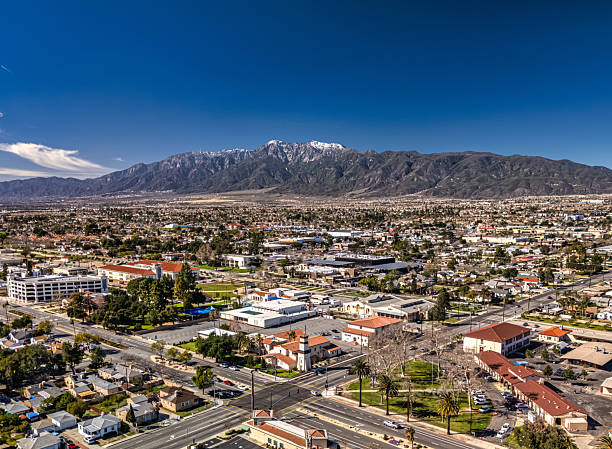
San Bernardino County continues to stand as one of the most closely watched affordability-driven housing markets in Southern California, yet recent data shows a shift that is not immediately visible in headline pricing. While home values appear relatively stable across the county, the underlying structure of the market is changing in ways that directly affect buyer activity, seller expectations, and overall transaction flow. The most recent late summer 2026 data highlights a market that is no longer defined by rapid movement or strong bidding competition, but instead by slower absorption and more cautious participation on both sides of the transaction.
Mortgage rates holding near the upper-6% range continue to suppress purchasing power, especially in entry-level and workforce housing segments that dominate San Bernardino County demand. At the same time, inventory levels are not tightening as aggressively as in prior cycles, creating a more balanced but slower-moving environment. These combined conditions are producing a market where stability in price does not necessarily translate into strength in demand. The following analysis focuses on how pricing behavior, transaction speed, and buyer psychology are reshaping the county’s housing dynamics during this current phase.
Stable Prices, but Weakening Transaction Volume
Recent San Bernardino County housing data shows a market that appears stable on the surface but is experiencing measurable softness in activity levels. According to Redfin’s August 2026 county report, the median sale price is approximately $548,165, reflecting a slight -0.15% year-over-year decline, while total homes sold dropped by nearly 2.9% year-over-year. This indicates that pricing is holding within a narrow range, but demand strength is not expanding alongside it.
At the city level within the county, variations become even more visible. Some submarkets such as San Bernardino city proper show slight price growth of around +0.4% year-over-year, but transaction volume remains relatively flat, signaling that price movement is being driven more by micro-local conditions than broad market momentum. This divergence between price and volume is one of the most important indicators of a cooling but not collapsing market.
What this creates is a situation where sellers are still anchored to recent pricing expectations, while buyers are becoming more selective and less urgent in their decision-making.
Inventory and Market Speed Are Resetting Expectations
One of the clearest shifts in the county is the gradual normalization of inventory and days-on-market metrics. Realtor.com’s August 2026 data shows active listings at approximately 15,400 homes, with median days on market around 62 days, reflecting a slower absorption pace compared to prior tightening cycles.
This increase in market duration signals a fundamental change in buyer behavior. Homes are no longer moving quickly by default; instead, listing performance now depends heavily on pricing accuracy at launch. Properties that are priced even slightly above market expectations tend to remain active longer, often requiring adjustments before generating serious offers.
National housing data from the same reporting window supports this slowdown pattern. U.S. existing-home sales fell to an annual pace of 3.98 million units in August 2026, while inventory rose to 1.62 million units nationally, the highest level in nearly seven years. This broader trend is filtering into Inland Empire markets like San Bernardino, where inventory is not excessive but is sufficient to slow competitive pressure.
Affordability Pressure and Mortgage Rates Are Driving Buyer Caution
Mortgage rates remain one of the most influential factors shaping San Bernardino County’s housing behavior. With 30-year fixed rates averaging in the mid-to-high 6% range during the late summer 2026 period, monthly payment sensitivity has become a major constraint for entry-level buyers.
Even modest changes in interest rates significantly affect affordability in this price tier. For many households, the difference of half a percentage point can determine whether a property is financially viable or out of reach. This has led to a noticeable shift in buyer behavior, where urgency has been replaced by comparison shopping and extended decision timelines.
Data from Zillow also reflects this cooling demand pressure, showing median days to pending at approximately 25–40 days depending on submarket, which is longer than previous high-velocity cycles. While homes are still selling, the pace is no longer competitive enough to generate consistent multiple-offer scenarios across most neighborhoods.
Negotiation Power Is Slowly Shifting Toward Buyers
Although San Bernardino County is not currently in a downturn, the balance of negotiation is gradually shifting. Data shows sale-to-list ratios hovering around 99% to 100%, meaning most homes are still selling close to asking price, but with increasing variability depending on condition and pricing strategy.
The share of listings with price reductions has also remained notable, with roughly 18%–20% of homes experiencing adjustments during listing periods. This suggests that sellers who initially price aggressively are more likely to encounter extended market time before securing offers.
At the same time, well-priced homes in desirable submarkets still move efficiently, showing that demand has not disappeared—it has simply become more conditional. Buyers are no longer reacting to scarcity pressure, but instead evaluating value more critically against monthly affordability constraints.
San Bernardino County’s housing market is currently defined by a quiet but important transition. Prices remain relatively stable, but transaction volume, listing duration, and buyer urgency all point toward a slower and more measured environment. This is not a market experiencing a sharp decline, but rather one adjusting to affordability limits and higher borrowing costs.
The key takeaway is that stability in pricing should not be interpreted as strength in demand. Instead, the current cycle reflects a market where buyers have regained time, sellers must adjust strategy more carefully, and execution matters more than momentum. Understanding this shift is essential for anyone positioning themselves in the county’s housing market today.
Thank you for taking the time to read and reflect. I write to help people think clearly about money, business, real estate, and life — not from theory, but from decades of lived experience.
If you are navigating a financial decision, building a business, considering homeownership, or simply trying to make better use of your time and resources, I invite you to engage further.
Subscribe to The Power Is Now TV to connect with me live every weekday, Monday through Friday, from 10:00 AM to 11:00 AM PST, as we record television shows across the Power Is Now TV Network. As a subscriber, you can participate in live tapings, engage in real-time discussions, and connect directly with industry leaders.
Visit ThePowerIsNow.com to access real estate magazines, books, podcasts, television shows, and exclusive media content focused on homeownership, business, and wealth-building.
For personalized support, consulting, and advisory services in real estate, mortgages, business, and personal finance, visit EricFrazier.com to schedule a consultation and learn more about my work as your trusted advisor in business and wealth.
Eric Lawrence Frazier, MBA
Your trusted advisor in business and wealth
www.ericfrazier.com | www.thepowerisnow.com
NMLS #461807 | CA DRE #01143484
Schedule a consultation: https://calendly.com/ericfrazier/real-estate-mortgage-consultation-clients
References
California Association of REALTORS®. (2026). Housing market update: Southern California regional report. https://www.car.org/aboutus/mediacenter/newsreleases/2026releases/July2026HomeSales
U.S. Department of Housing and Urban Development. (2026). Housing market indicators dashboard. https://www.huduser.gov/portal/datasets/hmd.html
Freddie Mac. (2026). Mortgage rates weekly update. https://www.freddiemac.com/pmms