
The Debt Comes Back

You need to be logged in to view this content. Please Log In. Not a Member? Join Us
The Hidden Connection Between Property Condition and Whether Your Home Can Be Insured
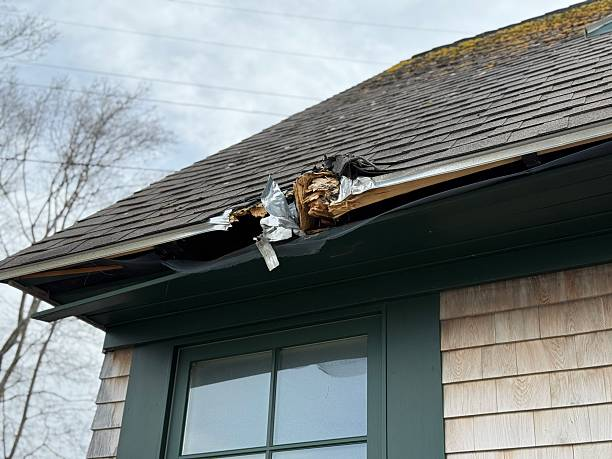
Homeownership decisions are often framed around purchase price, interest rates, and long-term appreciation, but an increasingly important factor is shaping whether a property can even remain insured in the first place: its physical condition. Insurance markets, particularly in high-risk regions, are no longer treating coverage as automatic. Instead, underwriting decisions are becoming more closely tied to how well a property is maintained, how resilient it is to environmental risks, and whether it meets evolving safety standards. Recent developments from the California Department of Insurance highlight this shift through its “Insurance Surge Expanding Options for Californians in Wildfire Distressed Areas” initiative. The state reported that 11 homeowners insurance groups, along with two major commercial insurers, have committed to expanding coverage availability as part of the broader Sustainable Insurance Strategy. This expansion is intended to increase access in wildfire-distressed areas where coverage has become more limited in recent years. However, increased availability does not guarantee universal access. Instead, insurers continue to evaluate individual properties based on risk characteristics that include structural condition, mitigation measures, and exposure to environmental hazards. This means that deferred maintenance is no longer just a repair issue—it is increasingly an underwriting issue that can influence insurability, pricing, and long-term financial stability. Why Property Condition Is Now Central to Insurance Decisions Insurance underwriting has traditionally considered factors such as location, claims history, and construction type. While these remain important, insurers are increasingly placing greater emphasis on property-level condition as a direct indicator of risk exposure. This shift is especially visible in regions affected by wildfire risk, where physical vulnerability can dramatically influence loss severity. Recent regulatory actions in California reflect this evolution. Under the Sustainable Insurance Strategy, insurers are being encouraged—and in some cases required—to expand coverage in high-risk areas in exchange for broader market participation commitments. Despite these efforts, insurers still retain the ability to assess individual properties based on risk mitigation. This means that even within expanding markets, homes with poor maintenance conditions may face higher premiums, limited coverage options, or in some cases, difficulty securing standard insurance altogether. The key change is not that insurance is disappearing, but that access is becoming more conditional. Property condition is now part of the risk equation in a way that directly affects insurability outcomes. Deferred Maintenance as an Underwriting Risk Factor Deferred maintenance is no longer viewed solely as a cosmetic or financial inconvenience. It is increasingly recognized as a contributor to loss severity during insured events. A home with an aging roof, outdated electrical system, or unmanaged vegetation presents a higher probability of damage during extreme weather or fire exposure. In wildfire-prone areas, regulatory frameworks such as California’s insurance reforms emphasize mitigation and property hardening as part of improving insurability. Insurers operating under these frameworks are required to consider forward-looking risk models rather than relying only on historical losses. This shift means that property condition is now evaluated through a preventative lens. A well-maintained home is not just less expensive to repair—it is statistically less likely to generate large claims. As a result, insurers increasingly differentiate between properties based on maintenance quality, even within the same geographic area. Examples of condition-related underwriting concerns include roof age and material type, exposed wiring or outdated electrical panels, plumbing integrity, and vegetation proximity to structures. Each of these factors contributes to how insurers assess the likelihood of claim severity. The Link Between Maintenance and Insurance Availability One of the most significant developments in recent years is the growing connection between property condition and insurance availability itself. In some markets, particularly those with elevated wildfire exposure, insurers have reduced exposure or withdrawn from segments of the market, creating tighter underwriting standards for remaining carriers. Regulatory efforts are attempting to reverse this trend by encouraging insurers to expand coverage in distressed regions. As part of California’s insurance market reforms, several carriers have committed to issuing new policies in wildfire-prone areas as part of a structured agreement with regulators. However, expanded availability does not eliminate underwriting scrutiny. Even as more insurers re-enter or expand in these markets, individual property assessments remain central to approval decisions. Homes that demonstrate strong maintenance and mitigation practices are more likely to qualify for standard coverage, while properties with deferred maintenance may be directed toward higher-cost or limited coverage options. This creates a dual outcome: broader market access at the system level, but increasingly selective access at the property level. Why Maintenance Now Affects Financing and Resale Value Insurance is closely linked to both financing and property value. Most mortgage lenders require active insurance coverage as a condition of loan approval. If a property becomes difficult to insure, it can also become more difficult to finance or refinance. Additionally, insurance costs are increasingly factored into buyer affordability calculations. Higher premiums reduce purchasing power, which can affect resale demand and pricing dynamics. A property with higher perceived insurance risk may experience downward pressure on value even if its physical structure remains intact. This means that deferred maintenance can have a cascading financial effect. What begins as a repair issue can evolve into an insurance issue, which can then become a financing issue, ultimately affecting marketability and valuation. The Shift Toward Risk-Based Property Management The broader trend emerging from insurance market changes is a shift toward risk-based property management. Homeownership is increasingly being evaluated not only in terms of acquisition and appreciation but also in terms of ongoing risk exposure. Properties that are actively maintained, upgraded, and protected against environmental hazards are positioned more favorably within this system. Maintenance is no longer just about preserving comfort or aesthetics; it is becoming part of a structured approach to maintaining financial access to insurance and credit markets. This shift places greater importance on proactive decision-making. Homeowners are now incentivized to address potential risks before they become underwriting concerns rather than after problems arise. The connection between property condition and insurability is becoming more direct and more consequential. As insurance markets adapt to increased environmental risk and evolving regulatory frameworks, underwriting decisions are
The Lender Is Never Above the Family: Why Debt Payoff Math Isn’t Enough

You need to be logged in to view this content. Please Log In. Not a Member? Join Us
Why Small Wins Aren’t Always Enough: The Reality of the Debt Snowball

You need to be logged in to view this content. Please Log In. Not a Member? Join Us
Los Angeles County Housing Market: Affordability Ceiling Effects and Transaction Suppression Zones Across Micro-Markets
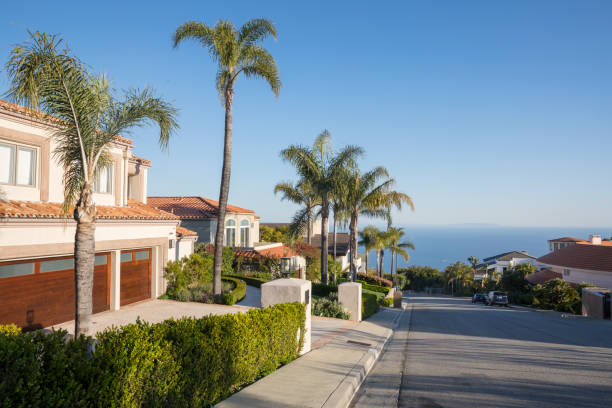
You need to be logged in to view this content. Please Log In. Not a Member? Join Us
San Diego County Housing Market: Price Resilience vs Transaction Slowdown Across Micro-Market Segments

San Diego County’s housing market continues to present one of the clearest examples of a divided real estate structure in Southern California. On the surface, prices remain relatively strong and stable, supported by limited inventory and long-term coastal demand. However, beneath this pricing stability, transaction activity has slowed in a way that signals shifting buyer behavior and increasing friction in the closing process. The result is a market that appears steady in valuation but less active in execution. Recent late summer 2026 data shows that homes are still maintaining strong price levels, yet fewer transactions are closing compared to earlier cycles. This divergence between pricing resilience and declining sales volume reflects broader affordability constraints driven by elevated mortgage rates and tightening buyer qualification standards. At the same time, San Diego’s internal market structure is becoming more segmented, with coastal, inland, and condo markets each responding differently to current conditions. Understanding these micro-market differences is essential to interpreting the true direction of the county’s housing landscape. Coastal Submarkets: Price Stability with Limited Turnover San Diego’s coastal regions, including areas such as La Jolla, Del Mar, and coastal Carlsbad, continue to demonstrate strong price resilience even as transaction volume softens. According to recent Realtor.com August 2026 data, median listing prices across San Diego County remain near $899,000, with coastal submarkets significantly higher depending on proximity to the ocean. While prices remain elevated, the pace of transactions has slowed, with many listings taking approximately 45 days or longer to reach contract stage. The key dynamic in coastal areas is limited inventory turnover. Homeowners with historically low mortgage rates are reluctant to sell, contributing to a “hold effect” that keeps supply tight. This structural constraint supports pricing stability even when demand softens. However, the number of closed transactions is no longer matching prior-year activity levels, indicating that buyer participation is more selective and less urgent. This creates a coastal market where values remain firm, but liquidity is reduced, resulting in fewer deals closing within shorter timeframes. Inland Submarkets: Increased Flexibility but Slower Buyer Conversion Inland areas such as Escondido, Riverside-adjacent North County corridors, and parts of East County are experiencing a different dynamic. These regions typically offer more affordability compared to coastal zones, yet even here, buyer conversion rates have slowed due to mortgage rate sensitivity. Recent California Association of REALTORS® data indicates that while inventory has not surged dramatically, it has increased enough to extend negotiation timelines. Properties in these inland submarkets are more likely to experience price adjustments before closing, particularly if initial listing prices exceed buyer expectations. Days on market in these areas often exceed county averages, reflecting the more cautious nature of affordability-driven demand. Unlike coastal markets, inland areas are not fully supported by wealth-driven buyers, making them more sensitive to financing conditions. As a result, even modest changes in interest rates have a noticeable impact on transaction speed and offer volume. Condo and Attached Housing Segment: Emerging First-Time Buyer Activity The condo and townhome segment is showing a different pattern compared to both coastal and inland detached housing markets. Recent data trends, supported by regional MLS reporting, indicate a gradual increase in buyer interest for attached housing, particularly among first-time buyers and downsizers who are priced out of single-family home ownership. This segment is seeing relatively higher transaction activity compared to detached homes, even though pricing growth is more subdued. Condo listings are also experiencing slightly longer market times in some submarkets, but they remain more accessible entry points into the San Diego housing market. A key driver is affordability substitution, where buyers accept smaller units or shared amenities in exchange for improved price alignment. However, even in this segment, financing constraints remain a limiting factor, meaning demand is present but not fully converting at previous cycle levels. This creates a “mid-speed market” where activity is stable but not accelerating. Pricing Resilience vs Transaction Decline: The Core Market Split The most important structural trend in San Diego County is the widening gap between price stability and transaction volume decline. According to Zillow and Redfin aggregated data for late summer 2026, median prices remain relatively stable year-over-year, while closed sales have declined compared to prior periods. National housing data reinforces this trend, showing U.S. existing-home sales falling to a 3.98 million annualized pace in August 2026, the lowest level in over a year, while inventory rose to 1.62 million units. San Diego reflects this national pattern in a more concentrated form. Prices remain supported by structural scarcity in desirable submarkets, but affordability constraints are limiting the number of qualified buyers. This creates a condition where homes are valued consistently but exchanged less frequently. The result is a market that is stable in valuation terms but weakening in liquidity terms, a distinction that is critical for understanding real market health. San Diego County’s housing market is currently defined by a clear split between pricing strength and declining transaction velocity. Coastal areas continue to support high values due to scarcity and long-term demand, while inland and attached housing segments reflect slower absorption driven by affordability constraints. Across all submarkets, the most consistent trend is reduced buyer urgency, which is extending market times and lowering transaction frequency. This environment does not indicate broad price deterioration but rather a shift toward lower liquidity and more selective participation. The key takeaway is that pricing strength alone no longer reflects market momentum. Instead, transaction activity and buyer conversion rates provide a more accurate measure of current conditions. San Diego remains structurally strong, but its market rhythm has clearly slowed. Thank you for taking the time to read and reflect. I write to help people think clearly about money, business, real estate, and life — not from theory, but from decades of lived experience. If you are navigating a financial decision, building a business, considering homeownership, or simply trying to make better use of your time and resources, I invite you to engage further. Subscribe to The Power Is Now TV to connect with me live
Orange County Luxury Housing Market: High-End Rebalancing and Pricing Dispersion Across Micro-Market Tiers

Orange County’s luxury housing segment is currently operating in a very different rhythm compared to the broader Southern California market. While overall housing conditions continue to reflect elevated mortgage rates and slower buyer activity, the high-end segment is behaving with its own internal structure, shaped less by broad affordability constraints and more by wealth concentration, cash activity, and property-specific value differentiation. As of late summer 2026, the luxury tier is no longer moving as a single unified market. Instead, it is splitting into clearly defined micro-segments where pricing behavior, time on market, and negotiation outcomes vary significantly depending on price band and property characteristics. This shift has created a more complex environment where headline prices alone do not accurately describe market strength or weakness. Instead, pricing dispersion between entry luxury homes, mid-tier estates, and ultra-luxury properties is widening, while transaction speed varies sharply across each segment. At the same time, buyer behavior is becoming more selective, with increased emphasis on turnkey condition, location quality, and long-term lifestyle value rather than urgency-driven acquisition. Understanding these structural changes is essential to interpreting how Orange County’s luxury market is evolving beyond simple appreciation or correction narratives. Segmented Luxury Market Structure and Tiered Behavior The Orange County luxury market is no longer functioning as a single price-driven segment. Instead, it is divided into three distinct tiers that behave independently. Homes priced between approximately $2 million and $4 million represent the most active layer of luxury activity, with market times averaging around 120–150 days depending on condition and submarket. This tier continues to attract move-up buyers and equity-rich households, but sensitivity to pricing accuracy has increased significantly. The mid-upper tier, generally between $4 million and $6 million, has become the most inventory-pressured segment. Properties in this range often remain on the market between 200 and 240 days, reflecting a narrower buyer pool and increased selectivity. Sellers in this bracket face the strongest need for precise pricing alignment, as overpricing leads to extended market exposure. At the ultra-luxury level above $6 million, conditions improve slightly due to a smaller but more committed buyer pool. Well-positioned properties in this category often move faster than mid-tier luxury homes, particularly when turnkey condition and location align. This segmentation highlights that Orange County luxury is driven more by micro-market dynamics than broad regional trends. Pricing Dispersion and Value Gap Expansion One of the most important developments in late 2026 is the widening gap between listing expectations and actual closing prices across luxury tiers. This dispersion is not uniform; it is most visible in properties that lack modern upgrades, optimal positioning, or turnkey readiness. Recent market tracking indicates that sale-to-list price spreads have narrowed in some high-end submarkets for well-prepared homes, while expanding significantly for properties requiring updates or carrying outdated design profiles. This divergence creates a pricing structure where two similarly located homes can experience completely different market outcomes depending on presentation quality and buyer perception of value. In practical terms, this means the market is no longer rewarding proximity or square footage alone. Instead, condition, design relevance, and perceived scarcity are increasingly driving final pricing outcomes. Cash buyers continue to play a central role in stabilizing higher-end segments, with nearly half of transactions above $5 million occurring without financing. However, even cash buyers are applying stricter valuation discipline, reducing speculative overbidding behavior that was more common in earlier market cycles. Transaction Behavior and Micro-Liquidity Differences Transaction speed across Orange County’s luxury market now varies significantly by tier, creating what can be described as micro-liquidity differences. Entry luxury homes continue to attract consistent activity, but they require accurate pricing from the outset to avoid extended market time. In contrast, mid-tier luxury properties are experiencing the slowest absorption rates due to overlapping inventory and cautious buyer selection. Ultra-luxury properties behave differently, often influenced by unique buyer motivations such as relocation, portfolio diversification, or lifestyle consolidation. While these transactions are fewer in number, they tend to be less sensitive to interest rate movements and more responsive to property uniqueness. This creates a paradox where higher-priced homes can sometimes move more efficiently than mid-tier luxury properties when correctly positioned. The result is a market where liquidity is not evenly distributed, and success depends heavily on aligning pricing strategy with the specific behavioral patterns of each segment rather than applying broad market assumptions. Macro Influence and Wealth-Driven Demand Stability Despite broader economic pressure from elevated interest rates, Orange County’s luxury segment remains supported by wealth-driven demand. A significant portion of high-end buyers are equity-rich individuals or cash purchasers who are less sensitive to financing conditions. This includes relocation buyers from high-growth tech markets and long-term California homeowners leveraging accumulated equity. However, even within this resilient buyer base, behavioral caution is increasing. Buyers are taking longer to evaluate properties, conducting deeper due diligence, and placing stronger emphasis on long-term value retention. This is contributing to slower transaction cycles even when demand remains structurally intact. At the same time, headline events such as record-setting off-market sales above $100 million continue to highlight the presence of extreme top-end demand, but these transactions are highly isolated and do not reflect broader market conditions. Instead, they reinforce the widening gap between ultra-wealthy buyer behavior and mid-luxury market dynamics. Orange County’s luxury housing market is currently defined by segmentation, dispersion, and behavioral divergence rather than uniform movement. The clear separation between entry luxury, mid-tier estates, and ultra-luxury properties has created distinct market rhythms that respond differently to pricing, condition, and buyer psychology. While wealth-driven demand continues to support the high end of the market, transaction speed and pricing outcomes are increasingly dependent on micro-level positioning rather than overall market direction. This environment rewards precision. Properties that are correctly priced and properly presented continue to transact efficiently, while misaligned listings experience extended market time and wider pricing adjustments. The key takeaway is that Orange County luxury real estate is no longer a single market story, but a layered structure where performance depends on understanding segment-specific behavior. Thank you for taking
San Bernardino County Housing Market: Low-End Price Stability Masks a Slowing Transaction Cycle in Late Summer 2026
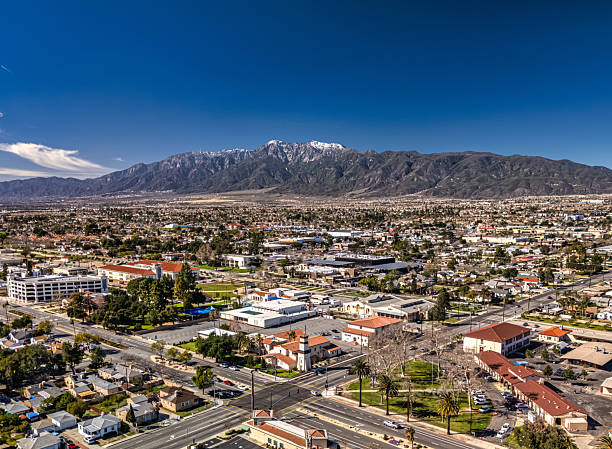
San Bernardino County continues to stand as one of the most closely watched affordability-driven housing markets in Southern California, yet recent data shows a shift that is not immediately visible in headline pricing. While home values appear relatively stable across the county, the underlying structure of the market is changing in ways that directly affect buyer activity, seller expectations, and overall transaction flow. The most recent late summer 2026 data highlights a market that is no longer defined by rapid movement or strong bidding competition, but instead by slower absorption and more cautious participation on both sides of the transaction. Mortgage rates holding near the upper-6% range continue to suppress purchasing power, especially in entry-level and workforce housing segments that dominate San Bernardino County demand. At the same time, inventory levels are not tightening as aggressively as in prior cycles, creating a more balanced but slower-moving environment. These combined conditions are producing a market where stability in price does not necessarily translate into strength in demand. The following analysis focuses on how pricing behavior, transaction speed, and buyer psychology are reshaping the county’s housing dynamics during this current phase. Stable Prices, but Weakening Transaction Volume Recent San Bernardino County housing data shows a market that appears stable on the surface but is experiencing measurable softness in activity levels. According to Redfin’s August 2026 county report, the median sale price is approximately $548,165, reflecting a slight -0.15% year-over-year decline, while total homes sold dropped by nearly 2.9% year-over-year. This indicates that pricing is holding within a narrow range, but demand strength is not expanding alongside it. At the city level within the county, variations become even more visible. Some submarkets such as San Bernardino city proper show slight price growth of around +0.4% year-over-year, but transaction volume remains relatively flat, signaling that price movement is being driven more by micro-local conditions than broad market momentum. This divergence between price and volume is one of the most important indicators of a cooling but not collapsing market. What this creates is a situation where sellers are still anchored to recent pricing expectations, while buyers are becoming more selective and less urgent in their decision-making. Inventory and Market Speed Are Resetting Expectations One of the clearest shifts in the county is the gradual normalization of inventory and days-on-market metrics. Realtor.com’s August 2026 data shows active listings at approximately 15,400 homes, with median days on market around 62 days, reflecting a slower absorption pace compared to prior tightening cycles. This increase in market duration signals a fundamental change in buyer behavior. Homes are no longer moving quickly by default; instead, listing performance now depends heavily on pricing accuracy at launch. Properties that are priced even slightly above market expectations tend to remain active longer, often requiring adjustments before generating serious offers. National housing data from the same reporting window supports this slowdown pattern. U.S. existing-home sales fell to an annual pace of 3.98 million units in August 2026, while inventory rose to 1.62 million units nationally, the highest level in nearly seven years. This broader trend is filtering into Inland Empire markets like San Bernardino, where inventory is not excessive but is sufficient to slow competitive pressure. Affordability Pressure and Mortgage Rates Are Driving Buyer Caution Mortgage rates remain one of the most influential factors shaping San Bernardino County’s housing behavior. With 30-year fixed rates averaging in the mid-to-high 6% range during the late summer 2026 period, monthly payment sensitivity has become a major constraint for entry-level buyers. Even modest changes in interest rates significantly affect affordability in this price tier. For many households, the difference of half a percentage point can determine whether a property is financially viable or out of reach. This has led to a noticeable shift in buyer behavior, where urgency has been replaced by comparison shopping and extended decision timelines. Data from Zillow also reflects this cooling demand pressure, showing median days to pending at approximately 25–40 days depending on submarket, which is longer than previous high-velocity cycles. While homes are still selling, the pace is no longer competitive enough to generate consistent multiple-offer scenarios across most neighborhoods. Negotiation Power Is Slowly Shifting Toward Buyers Although San Bernardino County is not currently in a downturn, the balance of negotiation is gradually shifting. Data shows sale-to-list ratios hovering around 99% to 100%, meaning most homes are still selling close to asking price, but with increasing variability depending on condition and pricing strategy. The share of listings with price reductions has also remained notable, with roughly 18%–20% of homes experiencing adjustments during listing periods. This suggests that sellers who initially price aggressively are more likely to encounter extended market time before securing offers. At the same time, well-priced homes in desirable submarkets still move efficiently, showing that demand has not disappeared—it has simply become more conditional. Buyers are no longer reacting to scarcity pressure, but instead evaluating value more critically against monthly affordability constraints. San Bernardino County’s housing market is currently defined by a quiet but important transition. Prices remain relatively stable, but transaction volume, listing duration, and buyer urgency all point toward a slower and more measured environment. This is not a market experiencing a sharp decline, but rather one adjusting to affordability limits and higher borrowing costs. The key takeaway is that stability in pricing should not be interpreted as strength in demand. Instead, the current cycle reflects a market where buyers have regained time, sellers must adjust strategy more carefully, and execution matters more than momentum. Understanding this shift is essential for anyone positioning themselves in the county’s housing market today. Thank you for taking the time to read and reflect. I write to help people think clearly about money, business, real estate, and life — not from theory, but from decades of lived experience. If you are navigating a financial decision, building a business, considering homeownership, or simply trying to make better use of your time and resources, I invite you to engage further. Subscribe to The
Overcoming Limiting Beliefs and Fear of Failure

One of the things I have learned about personal growth is that many of the limits we experience are not always external. Sometimes the greatest limitation is the conclusion we have already reached about ourselves. We decide we are too old, too inexperienced, too late, too different, too far behind, or simply not capable of doing something, and then we begin living according to that conclusion. That is what I mean by a limiting belief. It is not simply a negative thought. It is a belief that begins influencing our decisions, our confidence, and eventually our behavior. Once we believe something strongly enough, we often begin looking for evidence that proves it true. If I believe I am not good at business, every mistake becomes proof. If I believe I am not a leader, every difficult conversation becomes another reason to avoid leadership. If I believe I always fail, one setback can become evidence that I should stop trying. The danger is that the belief begins shaping the outcome. I believe the first step in changing that pattern is to identify the belief clearly. We cannot challenge something we have never named. Ask yourself: what am I telling myself about this situation? Maybe the thought is, “I am not qualified.” Perhaps it is, “People like me do not succeed at this.” It may be, “I tried before and it did not work.” Once the thought is clear, we can begin examining whether it is actually true or whether we have simply repeated it long enough that it feels true. Experience can teach us, but it can also trap us if we interpret it incorrectly. Failing at something once does not prove we are incapable of succeeding. It proves that a particular attempt, strategy, timing, or set of circumstances did not produce the result we wanted. That distinction matters. I have always believed that failure has to be separated from identity. Failing at something does not make you a failure. A business can fail. A presentation can fail. A strategy can fail. A relationship can fail. A decision can turn out badly. Those are events and outcomes. They are not complete definitions of the person who experienced them. Fear of failure becomes especially powerful when we attach too much meaning to the possibility of being wrong. We begin protecting ourselves from embarrassment, disappointment, criticism, or financial loss by avoiding action altogether. The problem is that avoiding action also has consequences. There is a cost to trying and failing, but there is also a cost to never trying. Opportunities pass. Skills remain undeveloped. Relationships are never created. Businesses are never started. Ideas remain ideas. Years can pass while a person remains completely safe and completely stuck. I am not suggesting that people should act recklessly. There is a difference between courage and poor judgment. We should evaluate risk, prepare carefully, seek advice, understand the financial implications, and think through possible outcomes. But preparation should help us act. It should not become another way of postponing action indefinitely. Sometimes we tell ourselves we are waiting for confidence. I believe confidence often comes after action, not before it. You make the call, and then you become more comfortable making calls. You give the presentation, and then you learn how to present better. You begin the business, and then you discover what you need to learn. You enter the unfamiliar room, and eventually it becomes familiar. Competence creates confidence, and competence usually requires practice. I also encourage people to look at the language they use with themselves. There is a significant difference between saying, “I cannot do this,” and saying, “I do not know how to do this yet.” One statement closes the door. The other identifies a problem that can potentially be solved. If I do not know something, I can learn. If I lack experience, I can gain experience. If I made a mistake, I can analyze it. If my approach failed, I can change the approach. That does not guarantee success, but it restores possibility. Another important principle is to stop comparing the beginning of your journey with someone else’s middle. We often see another person’s accomplishment without seeing the years of mistakes, rejection, training, uncertainty, and work behind it. Comparison can create the illusion that everyone else moved forward without fear. Most people who accomplish meaningful things experience doubt at some point. The difference is often that they learn how to move forward while the doubt is still present. I believe this is where courage becomes practical. Courage is not necessarily the absence of fear. It is the decision that fear will not receive the final vote. Sometimes that means taking a smaller step. Make the appointment. Submit the application. Ask the question. Write the first page. Create the business plan. Have the conversation. The first action does not have to solve the entire problem. It simply has to move you from thinking to doing. We should also learn to review setbacks honestly. If something failed, ask why. Was the goal unrealistic? Was the preparation inadequate? Was the timing wrong? Did we lack knowledge, capital, discipline, or support? There is much more value in a specific lesson than in a general conclusion that says, “I knew I couldn’t do it.” Ultimately, overcoming limiting beliefs requires us to stop allowing yesterday’s conclusions to control tomorrow’s possibilities. There will always be risk. There will always be uncertainty. There will always be situations where we cannot guarantee the outcome before we begin. But a meaningful life cannot be built entirely around guarantees. For me, the objective is not to eliminate fear before taking action. It is to think clearly, prepare responsibly, challenge the beliefs that have no factual foundation, and move forward anyway. Fear may be part of the conversation, but it does not have to make the decision. Thank you for taking the time to read and reflect. I write to help people think clearly about money, business, real estate, and life
Riverside County Housing Market: Inventory Expansion Meets Slowing Absorption in Late Summer 2026
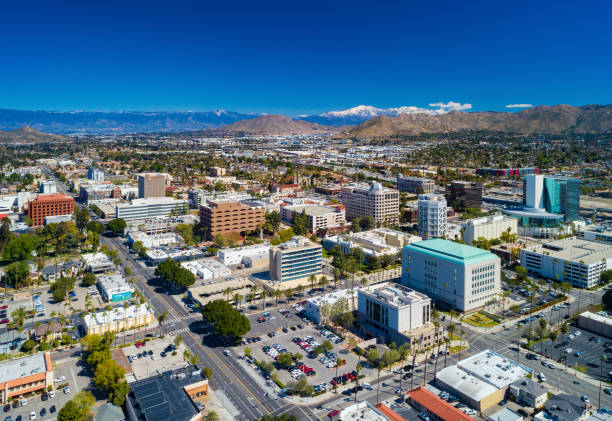
Riverside County’s housing market is moving through a phase where surface-level stability hides a deeper structural shift in buyer behavior and market absorption. While pricing has not collapsed, the balance between available homes and actual closed transactions has changed noticeably as summer transitions into early fall 2026. Mortgage rates holding in the mid-to-high 6% range continue to influence purchasing decisions, reducing affordability even in one of Southern California’s more accessible markets. At the same time, inventory trends are no longer tightening at the pace seen in previous cycles, creating a more complex environment for both buyers and sellers. Recent county-level reporting shows that price movements remain relatively narrow, yet the speed of transactions has slowed and listings are remaining active for longer periods. This combination suggests a market that is not declining sharply, but rather adjusting through reduced momentum. Understanding these shifts is important because they influence negotiation strength, pricing strategy, and long-term housing expectations across the Inland Empire. The current phase of Riverside County real estate is best understood through the interaction of inventory growth, sales contraction, and affordability pressure rather than price alone. Inventory Growth Without Equivalent Sales Absorption One of the most important developments in Riverside County is the divergence between inventory levels and closed sales activity. According to California Association of REALTORS® data, active listings and overall supply have shown signs of recovery compared to previous low-inventory cycles, but closed transactions have not kept pace. July 2026 data shows sales falling 13.7% month-over-month while median prices still increased 2.2% from the prior month, reaching approximately $649,000. This separation between price direction and sales volume indicates that pricing is being supported by constrained supply conditions rather than strong buyer demand. Realtor.com’s August 2026 tracking also shows a median listing price around $589,900, down roughly 1.5% year-over-year, while days on market averaged about 63 days. This longer marketing period suggests that homes are taking more time to secure qualified buyers, even when priced within recent market ranges. The presence of price reductions on roughly 18% of listings further highlights that sellers are increasingly adjusting expectations to match real-time buyer behavior rather than relying on prior pricing benchmarks. The overall condition reflects a market where inventory is no longer the limiting factor, but buyer conversion is becoming the constraint. Buyer Sensitivity Driven by Mortgage Rate Pressure Affordability continues to be the central force shaping Riverside County’s housing dynamics. With 30-year fixed mortgage rates hovering near the mid-to-high 6% range, purchasing power has been significantly reduced compared to earlier low-rate cycles. Even modest changes in interest rates have a disproportionate impact on monthly payment structures, particularly for first-time buyers who dominate much of Riverside’s demand base. This environment has led to slower decision-making and longer negotiation cycles. Buyers are no longer competing aggressively across multiple offers in most segments, which marks a shift from previous high-demand periods. Instead, there is more price comparison behavior, increased inspection scrutiny, and a greater willingness to wait for price adjustments. The result is a market where demand still exists, but is more cautious and selective, reducing the pace at which listings transition into escrow. Price Stability Masking Underlying Softening Pressure Although Riverside County has not experienced significant price declines, stability in median pricing does not necessarily reflect strength. Recent California Association of REALTORS® reports show that while year-over-year price movement remains slightly positive or flat, transaction volume trends point in the opposite direction. In July 2026, sales declined 2.6% year-over-year even as median pricing increased 3.0%, highlighting the disconnect between pricing and activity levels. This type of pattern often reflects a market in transition rather than expansion. Prices are being held up by a smaller pool of active inventory and by sellers choosing to wait rather than aggressively reduce listing values. However, as days on market extend and inventory gradually builds, pricing pressure typically emerges later in the cycle rather than immediately. The key takeaway is that stability in pricing should not be interpreted as acceleration. Instead, it reflects temporary equilibrium between slowing demand and gradually increasing supply. Shift Toward a Slower Transaction Environment The most visible change in Riverside County is not price movement but transaction velocity. Homes that previously moved within shorter marketing windows are now averaging longer listing periods, with multiple data sources indicating average market times between 53 and 63 days depending on methodology and dataset. This slowdown creates a ripple effect across the entire market structure. Sellers must plan for longer holding periods, buyers gain more negotiation leverage, and pricing strategies become more sensitive to initial listing accuracy. Properties that are mispriced at launch tend to experience longer correction cycles, often requiring reductions before attracting serious offers. This environment is less volatile than rapid appreciation cycles but requires more precision from both sides of the transaction. Riverside County’s housing market is currently defined by a clear imbalance between inventory recovery and slower buyer absorption. While prices have not declined sharply, the underlying structure shows reduced transaction speed, increased negotiation activity, and greater sensitivity to financing conditions. The combination of elevated mortgage rates and cautious buyer behavior is shaping a market that is steady on the surface but slower in execution beneath it. This phase does not signal a collapse but rather a recalibration of expectations across both buyers and sellers. Those entering the market are now operating in an environment where timing, pricing accuracy, and financing strategy matter more than momentum. Understanding these conditions provides a clearer picture of where opportunities exist and where delays are more likely. Thank you for taking the time to read and reflect. I write to help people think clearly about money, business, real estate, and life — not from theory, but from decades of lived experience. If you are navigating a financial decision, building a business, considering homeownership, or simply trying to make better use of your time and resources, I invite you to engage further. Subscribe to The Power Is Now TV to connect with me live every weekday, Monday through