
Building Authority Through Media Appearances and Public Speaking

Media appearances and public speaking can create enormous opportunities for professionals, business owners, executives, and advisors, but visibility alone does not create authority. Being interviewed, appearing on a podcast, speaking at a conference, or standing in front of an audience only gives you access to attention. What you do with that attention determines whether people remember you as someone who simply appeared or as someone whose ideas were worth hearing. I believe authority begins with clarity. Before any interview or presentation, you should know the central message you want the audience to remember. Too many people try to demonstrate how much they know by giving too much information. They answer every question with five additional points, move from one subject to another, and eventually lose the audience. Expertise is not demonstrated by saying everything you know. It is demonstrated by knowing what matters most and being able to explain it in a way people can understand. That is especially important in media because time is often limited. A television interview may give you only a few minutes. A podcast host may move rapidly between topics. A panel discussion may allow only a short response before another speaker takes over. You have to be able to organize your thinking quickly. What is the issue? Why does it matter? What does the audience need to understand? What should they do with the information? When your answers have structure, you sound more confident because the audience can follow your reasoning. Confidence is another important part of building authority, but I do not believe confidence means trying to sound perfect. In fact, people often become less effective speakers when they become too concerned about appearing polished. They memorize every sentence, worry about every word, and begin sounding like they are reciting rather than communicating. Preparation is important, but the objective should be to know the subject well enough that you can speak naturally about it. Real confidence comes from preparation and competence. Know your material. Understand the audience. Anticipate the questions you are likely to receive. Know the statistics, examples, or stories that support your position. If you are speaking about something you do not know, do not pretend otherwise. There is tremendous credibility in being able to say, “I do not have that information in front of me, but here is what I can tell you.” Authority is strengthened by honesty, not weakened by it. Audience engagement also requires us to remember that communication is not about the speaker. It is about the person receiving the message. I may be passionate about a subject, but if I cannot connect it to something the audience understands or cares about, I will lose them. A strong speaker constantly asks: Why should this matter to the person listening? That may require changing the way we explain the same information to different audiences. A room full of business owners may need a financial explanation. Consumers may need a practical example. Industry professionals may want technical depth. Community audiences may respond more strongly to the consequences the issue creates in everyday life. The central message can remain the same while the language and examples change. Storytelling can also strengthen audience engagement when it is used properly. People often remember an example long after they forget a statistic. A story about a client, a business challenge, a professional lesson, or a personal experience can help an audience understand why an idea matters. The key is that the story should serve the message. It should not become a long detour that causes the audience to forget the original point. The same principle applies to public speaking. I encourage speakers to think less about giving a speech and more about having a structured conversation with the room. Look at people. Allow important points to breathe. Listen when someone asks a question rather than mentally preparing your answer while they are still speaking. Use your voice naturally. You do not have to perform every sentence. Sometimes a calm, deliberate explanation carries more authority than dramatic delivery. Another important part of media coaching is learning how to handle difficult questions. A professional should not become defensive simply because an interviewer challenges a position. Listen carefully, acknowledge the question, and respond to the issue rather than reacting to the tone. If the premise of the question is wrong, correct it respectfully. If the issue is complicated, say so and explain why. The goal is not to win an argument with the interviewer. The goal is to demonstrate sound judgment in front of the audience. Consistency matters as well. Authority is rarely created through one appearance. It develops when people repeatedly see you discussing your area of expertise with knowledge, perspective, and professionalism. Articles, interviews, podcasts, videos, panels, webinars, and speaking engagements should reinforce the same general professional identity. Over time, the market begins associating your name with a particular body of knowledge. That is where media becomes much more than promotion. It becomes a way to demonstrate expertise publicly. The objective should not be to become the loudest person in the room or the person who appears everywhere. It should be to become someone audiences trust to make complicated ideas clearer. Speak with confidence because you have prepared. Communicate with clarity because you respect the audience’s time. Engage people because you understand that information becomes valuable only when someone can use it. When those disciplines come together, media appearances and public speaking stop being isolated opportunities for exposure. They become part of building a professional reputation, one informed conversation at a time. Thank you for taking the time to read and reflect. I write to help people think clearly about money, business, real estate, and life — not from theory, but from decades of lived experience. If you are navigating a financial decision, building a business, considering homeownership, or simply trying to make better use of your time and resources, I invite you to engage further. Subscribe to The Power Is Now TV
Strategic Decision-Making for Business Owners in Uncertain Markets

Every business owner eventually has to make important decisions without having all the information they would like to have. Markets change, interest rates move, consumer behavior shifts, competitors adjust, technology creates new pressures, and costs can rise faster than expected. Uncertainty is not unusual in business. What separates strong business owners from reactive ones is how they make decisions when the future is not clear. I believe one of the biggest mistakes an owner can make during uncertain times is to allow fear or optimism to replace analysis. Some owners freeze because they are afraid of making the wrong move. Others continue spending, hiring, or expanding because they assume conditions will improve. Neither approach is really strategic. Good decision-making requires us to acknowledge uncertainty while still making disciplined choices based on the information available to us. That begins with data. I do not believe business owners should make major decisions based solely on how they feel the company is performing. We need to know what the numbers are telling us. Revenue trends, profit margins, cash flow, customer activity, operating expenses, receivables, sales conversions, inventory levels, and employee productivity can all provide important information about what is actually happening inside the business. The numbers do not make the decision for us, but they help us understand the decision we are making. If sales have declined for three consecutive months, I want to know why. Is customer demand slowing? Has our pricing become uncompetitive? Has our marketing become less effective? Did we lose a major referral source? Are customers delaying purchases because of broader economic conditions? Until we understand the source of the change, reacting too quickly can create another problem. This is why business owners need to distinguish between a temporary event and a structural change. A weak month does not necessarily mean the business model is failing. At the same time, six months of declining margins should not be dismissed as a temporary setback. Strategic leadership requires us to recognize patterns early enough to respond intelligently. The second discipline is risk management. Every major business decision carries risk, but the goal is not to eliminate risk. If we attempted to remove every possibility of loss, we would probably never grow. The goal is to understand the risk before we accept it. Before making a significant investment, I want to know what happens if the decision does not perform as expected. If I hire additional employees, what level of revenue must those employees help generate or support? If I open another location, how long can the company carry the additional overhead before that location becomes profitable? If I borrow money for expansion, can the existing business support the payment if the expansion takes longer than planned? These questions are not negative thinking. They are responsible management. There is a major difference between taking a calculated risk and simply hoping things work out. One tool I encourage business owners to use is scenario planning. Instead of creating only one forecast based on what we expect to happen, create several. I like thinking in terms of a reasonable case, a stronger case, and a difficult case. Suppose I am considering an expansion and I believe it could generate an additional $500,000 in annual revenue. I should not build the entire decision around the assumption that $500,000 will occur. What happens if the business produces $350,000? What happens if it produces only $200,000 during the first year? How much additional payroll, rent, marketing, equipment, and working capital will be required under each scenario? When you run the numbers this way, you begin to see something important: the question is not only whether the opportunity is attractive. The question is whether the company can survive if the opportunity develops more slowly than anticipated. I also believe business owners should decide in advance which indicators will cause them to change direction. Too many people become emotionally attached to a decision simply because they made it. They continue investing money into an unsuccessful strategy because stopping feels like admitting failure. That is not leadership. Sometimes the best decision is to continue. Sometimes it is to modify the strategy. Sometimes it is to stop. The important thing is to establish measurable standards. If we launch a marketing campaign, what results do we expect within 30, 60, or 90 days? If we hire a salesperson, what performance should we reasonably expect after the training period? If we introduce a new product, how much demand must exist for us to continue supporting it? Those measurements create discipline because they prevent emotion from becoming the only reason we remain committed to a decision. There is another principle that becomes especially important in uncertain markets: protect optionality. I want business owners to avoid putting themselves into positions where one decision removes every other choice. Excessive debt, long-term obligations, overstaffing, or spending nearly all available cash on one expansion can limit the company’s ability to respond when conditions change. Sometimes the most strategic decision is not the most aggressive one. Maintaining liquidity, negotiating shorter commitments, testing an idea before fully investing in it, or expanding in phases can provide flexibility. Flexibility has real economic value when markets are changing. Ultimately, strategic decision-making is not about predicting the future perfectly. None of us can do that. It is about preparing the business so that uncertainty does not automatically become crisis. I want the business owner to understand the numbers, identify the risks, examine several possible outcomes, establish performance standards, and preserve enough financial and operational flexibility to adjust when circumstances change. That approach does not guarantee that every decision will be correct, but it dramatically improves the quality of the decision-making process. The strongest business owners are not necessarily the people who always know what will happen next. They are the people who have built the discipline to make thoughtful decisions even when they do not. Thank you for taking the time to read and reflect. I write to help people think clearly
Building a High-Performance Real Estate Sales PipelineBuilding a High-Performance Real Estate Sales Pipeline

One of the things I have learned about real estate is that sales production becomes much more difficult when an agent is constantly starting over. Too many agents operate from transaction to transaction. They close a sale, celebrate the commission, handle the details of the transaction, and then suddenly realize they do not have enough prospects behind it. They go back to prospecting under pressure, searching for the next buyer or seller. That cycle creates inconsistent income because there is no real pipeline supporting the business. I believe a successful real estate professional has to think beyond the next transaction. The objective is to build a continuous flow of opportunities at different stages of the sales process. Some people may be ready to buy or sell today. Others may be three months away, six months away, or even a year away. A strong pipeline recognizes that all of these people have value if the agent has a system for staying connected with them. The first part of building that pipeline is consistent prospecting. Real estate agents sometimes treat prospecting as something they do when business is slow. I believe it has to become part of the normal operating discipline of the business. If you only prospect when you need a closing, you are already late. The conversations that create business three or six months from now often need to begin today. Prospecting can come from many places. Past clients, referrals, open houses, community involvement, professional relationships, online inquiries, social media, geographic farming, homeowners considering selling, investors, renters who may become buyers, and people within an agent’s personal network can all become sources of future business. The important issue is not choosing one magical source of leads. It is creating enough consistent activity that the agent is never dependent upon a single source. That leads directly to follow-up, which in my experience is where many opportunities are lost. Agents frequently concentrate on the people who are ready immediately and neglect everyone else. But someone who says, “I’m probably going to buy next year,” has not told you no. They have given you a timeline. The question becomes what happens between that first conversation and the time they are ready. A professional follow-up system should allow the agent to stay relevant without becoming annoying. That means remembering what the client is trying to accomplish and communicating information that matters to that goal. A potential buyer may need mortgage information, credit preparation, neighborhood updates, or changes in available inventory. A homeowner considering selling may want to understand property values, market conditions, preparation strategies, and the financial implications of moving. This is where a good CRM becomes important. I do not believe an agent should attempt to manage hundreds of relationships from memory, text messages, and handwritten notes. The CRM should tell you who the prospect is, what they want, when you last communicated, what the next action should be, and where that person sits in the pipeline. However, technology cannot replace discipline. Purchasing a CRM does not create a sales system. The agent still has to use it. Leads need to be entered. Notes need to be updated. Follow-up dates need to be scheduled. Tasks need to be completed. The value of the technology comes from the consistency of the behavior behind it. The third part of the pipeline is conversion. Generating a large number of leads does not mean much if very few of those leads become appointments, signed clients, and ultimately closed transactions. Agents should know their numbers. How many conversations are required to create an appointment? How many appointments become clients? How many clients actually purchase or sell? How many transactions close? Once an agent understands those numbers, real estate begins to become much more predictable. If I know that a certain level of weekly prospecting activity historically produces a certain number of consultations and closings, I can begin managing the business rather than simply hoping business appears. I also encourage agents to separate their pipeline by stage. A new lead should not be treated exactly like someone who has completed a consultation and plans to purchase within 60 days. There should be clear categories such as new prospects, active follow-up, qualified buyers or sellers, appointments scheduled, clients under agreement, transactions pending, and closed clients who return to the long-term relationship database. That structure helps an agent understand where business is coming from and where opportunities are being lost. If plenty of leads are entering but few appointments are being scheduled, the problem may be follow-up. If appointments are occurring but clients are not committing, the issue may be presentation, trust, qualification, or the value proposition. If clients are signing but transactions are not closing, the problem may exist somewhere else in the process. For me, the goal is to move agents away from thinking of themselves simply as people who sell houses. A serious real estate professional is operating a business, and businesses require predictable systems for generating customers. A high-performance sales pipeline creates that predictability. Prospect every day, follow up consistently, know where every opportunity stands, measure conversion, and remain connected after the transaction closes. When those disciplines become part of the normal operation of the business, the agent is no longer depending entirely on luck, market conditions, or the next referral. That is when real estate production begins to become a business instead of a series of transactions. Thank you for taking the time to read and reflect. I write to help people think clearly about money, business, real estate, and life — not from theory, but from decades of lived experience. If you are navigating a financial decision, building a business, considering homeownership, or simply trying to make better use of your time and resources, I invite you to engage further. Subscribe to The Power Is Now TV to connect with me live every weekday, Monday through Friday, from 10:00 AM to 11:00 AM PST, as we record television shows across the Power Is Now
Building Trust and Compliance in Mortgage Advisory Services

Mortgage lending is one of those businesses where trust can be lost very quickly. We are asking people to make decisions involving hundreds of thousands of dollars, their monthly household budget, their savings, and often the largest financial asset they will ever own. For that reason, I believe credibility in mortgage lending has to be built on three things that cannot be separated: transparency, accuracy, and compliance. I have never believed that compliance should be viewed simply as a department that tells loan officers what they cannot do. Compliance is part of protecting the borrower, the company, and the mortgage professional. Regulations establish boundaries around how loans are presented, disclosed, priced, originated, and communicated, and a professional who understands those boundaries is in a much stronger position to advise a client responsibly. Transparency begins with the conversation. Borrowers should understand what they are being offered, what it is going to cost, what can change, and what cannot. If we are discussing an interest rate, we should be clear about whether that rate is merely an illustration, currently available, or actually locked. If points are being charged, the borrower should understand what those points accomplish. If lender credits reduce closing costs but affect pricing, that relationship should be explained rather than hidden inside the numbers. The same principle applies to fees. I do not want a borrower reaching the closing table and asking, “Where did this charge come from?” There may occasionally be legitimate changes during a mortgage transaction, but surprises should never result from a mortgage professional failing to explain something that could reasonably have been explained earlier. The Loan Estimate and Closing Disclosure exist partly to give consumers standardized information about loan terms and costs, and current CFPB rules establish specific disclosure and timing requirements for covered transactions. Accuracy is equally important. Mortgage professionals work in an environment where small errors can become large problems. Income, assets, credit, property information, loan programs, interest rates, closing costs, debt ratios, and underwriting requirements all have to be communicated carefully. If I do not know the answer to a question, I would rather tell a client that I need to verify it than give an answer that sounds confident but turns out to be wrong. That discipline becomes particularly important when discussing underwriting. Loan officers should be careful about making promises that ultimately belong to an underwriter or creditor. We can explain guidelines, evaluate information, identify potential issues, and provide our professional assessment, but we should not create false certainty. Telling someone, “I believe this can work based on the information we currently have,” is very different from promising an approval that has not occurred. Compliance also affects the way mortgage professionals sell. The CFPB’s current Regulation Z resources identify restrictions involving loan-originator compensation and steering, along with qualification requirements. Those rules are important because consumers should be guided toward financing based on their circumstances and legitimate loan options, not because a particular transaction produces a better financial result for the originator. I believe this is where the difference between selling and advising becomes very clear. If my objective is simply to close the loan, I may be tempted to concentrate on the option most likely to get the borrower to say yes. If my objective is to advise the borrower, I have to help them understand the advantages, costs, risks, and tradeoffs among appropriate alternatives. That may mean discussing whether it makes sense to pay discount points or retain cash. It may mean comparing different down-payment strategies or loan structures. It may even mean telling a borrower that waiting, reducing debt, improving credit, or accumulating additional reserves may put them in a stronger financial position. The transaction matters, but the quality of the advice matters more because that is what creates the long-term relationship. Documentation is another important part of professionalism. Important conversations, disclosures, changes, approvals, and borrower decisions should be properly recorded within the systems required by the company. A mortgage professional should never rely exclusively on memory, especially when managing multiple transactions. Good documentation creates accountability and allows everyone involved in the loan to understand what happened and why. I also believe mortgage professionals have a responsibility to continue educating themselves. Lending regulations change, agency guidelines change, loan programs change, technology changes, and company policies change. Experience is valuable, but experience does not give us permission to stop learning. The longer someone remains in this industry, the more important it becomes to distinguish between what used to be true and what is actually required today. Ultimately, borrowers are not expecting mortgage professionals to know the future or eliminate every complication from a transaction. They are expecting us to tell them the truth, explain the numbers, protect confidential information, follow the rules, communicate changes, and give them accurate information from which to make a decision. That is how credibility is built in mortgage lending. Compliance establishes the standard, accuracy protects the decision, and transparency creates the trust. When those three become part of the way a mortgage professional operates every day, compliance stops being something separate from customer service and becomes one of the strongest forms of customer service we can provide. Thank you for taking the time to read and reflect. I write to help people think clearly about money, business, real estate, and life — not from theory, but from decades of lived experience. If you are navigating a financial decision, building a business, considering homeownership, or simply trying to make better use of your time and resources, I invite you to engage further. Subscribe to The Power Is Now TV to connect with me live every weekday, Monday through Friday, from 10:00 AM to 11:00 AM PST, as we record television shows across the Power Is Now TV Network. As a subscriber, you can participate in live tapings, engage in real-time discussions, and connect directly with industry leaders. Visit ThePowerIsNow.com to access real estate magazines, books, podcasts, television shows, and exclusive media content focused on homeownership,
Achieving Work-Life Integration in High-Pressure Careers

One of the lessons I have learned about demanding careers is that work can consume as much of your life as you allow it to consume. There is always another phone call to return, another email to answer, another meeting to attend, another client who needs something, and another project that feels urgent. If we are not careful, productivity can become the measurement we use for our entire life, and eventually everything outside of work begins receiving whatever time and energy happen to be left over. I prefer to think about work-life integration rather than perfect work-life balance. Balance can suggest that every area of life should receive equal time every day, and I do not believe that is realistic. There will be seasons when the business requires more attention. There will also be times when family, health, faith, rest, or personal responsibilities need to take priority. The objective is not perfect equality. The objective is to make sure one area of life does not continuously consume everything else. That begins with prioritization. Being busy and being productive are not the same thing. I can spend an entire day answering messages, attending meetings, and reacting to other people’s priorities without accomplishing the few things that actually move my life or business forward. That is why I believe we have to decide what is important before the day begins deciding for us. I encourage people in high-pressure careers to identify the responsibilities that truly require their attention and separate them from activities that can be delegated, scheduled differently, automated, or eliminated. Everything that appears on our calendar is not equally valuable. Some activities produce revenue. Some strengthen important relationships. Some require our personal judgment. Others exist because we have simply developed the habit of doing them. Time management is therefore not just about finding more hours. It is about deciding what deserves the hours we already have. I also believe in protecting blocks of focused time. Constant interruptions make it difficult to do meaningful work. If every notification, phone call, email, and message receives an immediate response, we may appear available while becoming increasingly ineffective. There should be periods during the day when important work receives our full attention, followed by designated times for communication and follow-up. The same discipline applies outside of work. Family time should not always become the place where unfinished business is completed. It is difficult to be fully present with the people we care about when we are physically in the room but mentally answering emails, thinking about tomorrow’s meeting, or checking the phone every few minutes. That is where boundaries become important. A boundary is not a declaration that work no longer matters. It is a decision that work has a place. There may be legitimate emergencies that require immediate attention, especially when we carry significant professional responsibilities. But if everything is treated as an emergency, then we have not created a boundary; we have created permanent availability. Technology has made this more difficult because work can now follow us everywhere. The office can be in our pocket, on the kitchen table, beside the bed, or with us while we are supposedly taking time away. We have to make conscious decisions about when we will respond, when we will disconnect, and which situations actually require immediate access to us. I also think we have to become comfortable saying no. Many people become overwhelmed not because they lack discipline but because they have accepted more responsibilities than any reasonable schedule can support. Every yes has a cost. Saying yes to another committee, project, client, meeting, or obligation means that time will come from somewhere else. That does not mean becoming selfish or unavailable. It means understanding capacity. A person who continuously overcommits eventually begins disappointing people because there is simply not enough time or energy to fulfill every commitment well. Another important part of work-life integration is recognizing that rest is not wasted time. People working in competitive careers sometimes treat exhaustion as evidence of commitment. I do not. There is nothing impressive about repeatedly pushing yourself to the point where your judgment, health, patience, creativity, and relationships begin deteriorating. Rest supports performance. Exercise supports performance. Time with family supports perspective. Reflection supports decision-making. Faith, community, friendships, and interests outside of work remind us that our professional title is only one part of who we are. The goal is not to become less ambitious. I believe ambition and discipline can coexist with a meaningful personal life. But success has to be defined broadly enough that achieving one objective does not require destroying everything else that matters. Ultimately, work-life integration requires intentional choices. We have to decide what deserves our attention, establish boundaries around what does not, manage our calendars according to priorities, and recognize when our current pace is no longer sustainable. A high-pressure career can create tremendous opportunities, but it should not require us to surrender our entire lives to maintain it. I want to work hard, pursue excellence, meet my responsibilities, and accomplish meaningful things. But I also want to remain present for the people, relationships, values, and experiences that give those accomplishments meaning. The real objective is not separating work from life completely, but building a life in which meaningful work has an important place without taking every place. Thank you for taking the time to read and reflect. I write to help people think clearly about money, business, real estate, and life — not from theory, but from decades of lived experience. If you are navigating a financial decision, building a business, considering homeownership, or simply trying to make better use of your time and resources, I invite you to engage further. Subscribe to The Power Is Now TV to connect with me live every weekday, Monday through Friday, from 10:00 AM to 11:00 AM PST, as we record television shows across the Power Is Now TV Network. As a subscriber, you can participate in live tapings, engage in real-time discussions,
Negotiating Business Sales for Maximum Value

Selling a business is not just a financial transaction. For many owners, it represents years of work, sacrifice, risk, and personal identity. That emotional connection can make negotiation difficult because the seller may naturally focus on what the business means to them, while the buyer is focused on what the business is worth based on future performance, risk, and return. I believe one of the most important things a business owner can do is prepare for that difference before negotiations begin. Good negotiation starts long before someone makes an offer. If I am preparing to sell a business, I want to understand the company’s financial condition, valuation, growth potential, weaknesses, and likely buyer concerns. I also want to know what I am willing to accept and what terms matter to me beyond the purchase price. Preparation creates confidence because I am not making major decisions for the first time while sitting across the table from a buyer. This is why valuation is so important. An owner should have a realistic understanding of the business before entering negotiations. Revenue by itself does not determine value. Buyers will look at profitability, cash flow, customer concentration, management strength, recurring revenue, assets, liabilities, competitive position, and the degree to which the company depends on the current owner. If I understand those factors in advance, I can explain the strengths of the company much more effectively. I also believe sellers need to understand the buyer. Not every buyer values the same things. A financial buyer may be primarily interested in cash flow and return on investment. A strategic buyer may see value in your customers, technology, geographic presence, employees, contracts, or market position because those assets strengthen an existing business. An individual buyer may be looking for a company they can personally operate. Understanding the buyer’s motivation can change the negotiation. If I know why the buyer wants the business, I can better understand where the value exists from their perspective. That does not mean manipulating the buyer. It means recognizing that the same company can have different strategic value to different purchasers. Price is important, but I do not believe sellers should negotiate only on price. The structure of the transaction can have just as much impact on the final outcome. How much money will be paid at closing? Is part of the purchase price financed by the seller? Is there an earnout based on future performance? Will the seller remain involved for a transition period? What happens to existing debt? How will working capital be treated? Are there conditions that could reduce the amount ultimately received? An offer that looks higher on paper is not always the better offer if much of the money depends on uncertain future events. This is why I encourage sellers to look at the quality of the offer, not simply the size of the number. A lower purchase price with strong financing, substantial cash at closing, limited contingencies, and a clear closing schedule may be more attractive than a higher offer with complicated conditions and significant uncertainty. Another important part of negotiation is knowing your priorities before the conversation becomes emotional. Some owners care most about receiving the highest possible price. Others may care about protecting employees, preserving the company name, maintaining the business in the community, or ensuring that the buyer continues serving longtime customers. There is nothing wrong with those priorities, but the seller should identify them early. Negotiation becomes much more difficult when every issue feels equally important. I want to know where I can be flexible and where I cannot. Maybe the price is firm but the transition period is negotiable. Maybe I am willing to finance a small portion of the transaction if the overall terms are strong. Maybe I will accept a longer closing period for a buyer with better financing. That type of preparation prevents the seller from reacting impulsively to each request. I also believe owners should avoid negotiating from desperation. If the buyer senses that the seller must complete the transaction quickly because of financial pressure, health concerns, burnout, or another urgent problem, the seller’s leverage may be reduced. This is another reason why planning a sale well in advance is so important. Time creates options, and options create negotiating strength. At the same time, sellers should remain realistic. Holding out for an unrealistic price can destroy a good transaction. There is a difference between negotiating firmly and refusing to acknowledge what the market is telling you. A professional advisor, valuation expert, attorney, accountant, or transaction specialist can help provide perspective when emotions begin influencing the decision. Due diligence is another critical part of the negotiation process. Buyers will review financial statements, tax returns, contracts, leases, employee information, litigation, licenses, customer concentration, and other records. If problems appear unexpectedly, the buyer may attempt to renegotiate the price or walk away. That is why I prefer to identify weaknesses before negotiations begin. If there is an issue, understand it and prepare an explanation or solution. Surprises weaken trust. Ultimately, negotiating a business sale is about understanding value, understanding the buyer, and understanding your own objectives. The seller who enters the process prepared is in a much stronger position to evaluate offers, defend value, and recognize when compromise makes sense. For me, the goal is not simply to win every point in the negotiation. The goal is to structure a transaction that fairly reflects the value of the business and gives the seller confidence that years of work have been converted into the strongest reasonable financial outcome. A successful negotiation is not just about getting a buyer to agree to a number. It is about understanding exactly what you are giving up, exactly what you are receiving, and making sure the terms support the value you spent years creating. Thank you for taking the time to read and reflect. I write to help people think clearly about money, business, real estate, and life — not from theory, but from decades
Mortgage Interest Is Deductible, but Not the Way Many Homeowners Think

Mortgage interest is one of the most frequently referenced tax benefits associated with homeownership, yet it is also one of the most misunderstood. Many homeowners assume that every dollar paid toward interest automatically reduces their tax bill in a straightforward way. In reality, the deduction operates under strict rules that determine who qualifies, how much debt is eligible, and how the benefit is applied within the broader tax system. Current IRS guidance under Publication 936 establishes that taxpayers may generally deduct interest on up to $750,000 of qualifying mortgage debt for loans originated after December 15, 2017, or $375,000 for married individuals filing separately. Older loans may qualify under higher grandfathered thresholds, depending on when the debt was incurred. However, the presence of a deduction does not eliminate the cost of borrowing. Instead, it reduces taxable income, which means the benefit depends on income level, filing status, and whether a taxpayer itemizes deductions. In addition, not all home-related borrowing qualifies automatically. The use of loan proceeds plays a critical role in determining whether interest is deductible at all. Understanding these mechanics is essential for homeowners who want to evaluate borrowing decisions based on financial reality rather than assumptions about tax relief. The Real Structure of the Mortgage Interest Deduction The mortgage interest deduction applies only to “qualified residence interest,” which is generally interest paid on loans secured by a primary or secondary residence. The key condition is that the debt must be secured by the home and used for specific purposes such as buying, building, or substantially improving the property. For post-2017 loans, the IRS limits deductible interest to the first $750,000 of total qualifying mortgage debt across all eligible homes. This limit is not per property but combined across a taxpayer’s residences. This distinction is often misunderstood. A homeowner with multiple properties cannot apply the limit separately to each one. Instead, the combined balance determines how much interest qualifies for deduction. Any interest tied to debt above the threshold is not deductible, even if it is paid in full. Additionally, taxpayers must itemize deductions to benefit. If the standard deduction is higher than total itemized deductions, including mortgage interest, the taxpayer receives no incremental benefit from mortgage interest payments. Why the Deduction Does Not Reduce Interest Costs A common misconception is that the mortgage interest deduction makes borrowing cheaper in a direct sense. In practice, it does not reduce the interest charged by the lender, nor does it eliminate the obligation to pay it. It only reduces taxable income, which may or may not translate into meaningful savings depending on the taxpayer’s marginal tax rate. For example, a homeowner paying $15,000 in mortgage interest does not receive a $15,000 tax reduction. Instead, that amount is subtracted from taxable income, and the actual benefit depends on the applicable tax bracket. This creates a partial offset rather than a dollar-for-dollar reimbursement. As a result, the financial structure of a mortgage remains primarily determined by interest rates, loan terms, and amortization schedules—not tax deductions. Home Equity Debt Requires Even More Careful Analysis One of the most frequently misunderstood areas of mortgage-related tax rules involves home equity borrowing. While many assume that any loan secured by a home automatically qualifies for interest deduction, IRS rules are more restrictive. Interest on home equity loans or lines of credit is only deductible if the borrowed funds are used to buy, build, or substantially improve the home that secures the loan. If the proceeds are used for unrelated purposes—such as paying off credit cards, covering education expenses, or funding personal consumption—the interest is generally not deductible. This creates a critical distinction between “secured debt” and “qualified use.” A loan may be secured by a home but still fail to qualify for interest deduction depending on how the funds are used. This rule is especially important in periods where homeowners rely on home equity as a source of liquidity. Borrowing against a home should be evaluated based on financial necessity and repayment capacity, not assumed tax advantages. The Debt Limit Is Not a Deduction Cap Another frequent misunderstanding involves the $750,000 figure. This number is often interpreted as a limit on how much interest can be deducted. In reality, it is a limit on the amount of mortgage debt that qualifies for interest deduction. This means the IRS does not cap the interest amount directly. Instead, it limits the portion of the loan balance that generates deductible interest. If a mortgage exceeds the threshold, only a proportional share of the interest may be deductible. This distinction becomes especially important for higher-value properties or households with multiple loans. In those cases, the deductible portion of interest may be significantly lower than total interest paid. Why Borrowing Decisions Should Come Before Tax Assumptions One of the most important implications of mortgage interest rules is that borrowing decisions should not be justified by expected tax benefits. The presence of a deduction does not make debt less expensive in real economic terms. A financially sound mortgage decision should be based on interest rate affordability, income stability, long-term repayment capacity, and overall household financial resilience. Tax treatment is a secondary consideration, not a primary driver. In some cases, borrowers may take on additional debt assuming tax advantages that do not meaningfully offset long-term costs. This can lead to overleveraging and reduced financial flexibility, particularly when interest rates are elevated or income conditions change. Mortgage interest remains one of the most visible tax benefits associated with homeownership, but its actual impact is often overstated. Under current IRS rules, the deduction is limited by loan size, filing status, and use of funds, and it only applies when taxpayers itemize deductions. More importantly, the deduction does not reduce the underlying cost of borrowing. It simply adjusts taxable income, which means the real economic weight of mortgage debt remains intact. Home equity borrowing introduces additional complexity, as deductibility depends on how funds are used rather than simply how loans are structured. Ultimately, the most important
Do Homeownership Tax Deductions Actually Save You Money? First Compare Them With the Standard Deduction

Homeownership is often marketed as a financial decision that automatically delivers tax advantages. Among the most commonly cited benefits is the ability to deduct mortgage interest, property taxes, and other housing-related expenses. While these provisions do exist within the tax code, their real-world value depends heavily on a factor that is frequently ignored in casual discussions: whether a taxpayer actually itemizes deductions or takes the standard deduction. For tax year 2026, the standard deduction is set at $32,200 for married couples filing jointly, $16,100 for single filers, and $24,150 for heads of household. This means that before any mortgage interest or property tax benefit is considered, a household must first exceed these baseline amounts through itemized deductions in order to receive any additional tax advantage. This distinction is critical because it reframes the entire conversation around homeownership and taxes. A deduction does not automatically reduce tax liability for every homeowner. Instead, it operates within a system where taxpayers must choose between two pathways—standard deduction or itemized deductions—and only one produces incremental benefit. Understanding this structure is essential for evaluating whether homeownership delivers meaningful tax savings or whether the perceived benefit is overstated in many financial decisions. The Standard Deduction Sets the Baseline for Tax Benefits The standard deduction functions as the default reduction in taxable income for most taxpayers. It is designed to simplify tax filing by allowing individuals to subtract a fixed amount without tracking or documenting specific expenses. In 2026, these amounts are substantial enough that a large portion of households benefit more from taking the standard deduction than from itemizing. For many filers, especially those without high mortgage interest or significant deductible expenses, the standard deduction effectively replaces itemized deductions entirely. This is the first major misconception in homeownership tax planning: many households assume they are receiving additional tax benefits from owning a home when, in reality, they are simply using the standard deduction that would apply regardless of homeownership status. The implication is straightforward. If a homeowner’s total itemizable expenses—including mortgage interest, property taxes, and charitable contributions—do not exceed the standard deduction threshold, then the mortgage interest deduction provides no additional financial benefit. Why Mortgage Interest Often Fails to Create Additional Tax Savings Mortgage interest is frequently presented as a key advantage of homeownership, but its actual impact depends on both loan structure and tax filing strategy. The IRS allows interest deductions on qualifying mortgage debt, but only if the taxpayer itemizes deductions instead of using the standard deduction. This creates a two-layer requirement: The taxpayer must have eligible mortgage interest. Total itemized deductions must exceed the standard deduction. If either condition is not met, the mortgage interest deduction does not produce incremental tax savings. This is particularly important in the current housing environment, where higher standard deduction levels mean fewer households benefit from itemizing at all. As a result, many homeowners who assume they are receiving a tax benefit from mortgage interest are actually receiving no additional advantage beyond what non-homeowners already receive through the standard deduction. The Role of Property Taxes in the Itemization Equation Property taxes are another component often included in discussions about homeownership tax benefits. However, like mortgage interest, property taxes only contribute to savings if the taxpayer itemizes deductions. Even when combined with mortgage interest, charitable contributions, and other eligible expenses, many households still do not surpass the standard deduction threshold. This is especially true for first-time buyers with smaller mortgages or those who have refinanced into lower-interest loans. In practice, this means that property taxes often represent a cash expense without producing a corresponding federal tax offset for a large share of homeowners. The tax code does not reimburse these payments directly; it only allows them to be deducted under specific conditions that many taxpayers do not meet. Why the Tax Benefit Is Often Misunderstood The misunderstanding around homeownership tax benefits typically comes from conflating three separate ideas: Paying mortgage interest Having deductible expenses Actually reducing taxable income beyond the standard deduction These are not interchangeable. A homeowner can pay significant interest and still receive no additional tax benefit if itemization is not advantageous. Additionally, tax brackets further complicate perception. A deduction reduces taxable income, not tax owed directly. The actual savings depend on the taxpayer’s marginal tax rate, meaning the benefit varies widely between households. This structure often leads to overstated expectations of tax savings when purchasing a home, especially when financial decisions are based on simplified assumptions rather than full tax calculations. Why Homeownership Still Makes Sense Without Tax Assumptions Even without assuming major tax benefits, homeownership can still be financially justified. The economic case for owning a home is typically built on factors such as long-term housing stability, forced equity accumulation through mortgage repayment, and potential appreciation over time. These drivers operate independently of tax deductions. In many cases, the decision to purchase a home is strengthened or weakened more by interest rates, purchase price, insurance costs, and maintenance obligations than by tax considerations. This distinction is important because it shifts homeownership analysis away from assumed tax advantages and toward measurable financial fundamentals. The idea that homeownership automatically delivers significant tax savings is often overstated. For tax year 2026, the standard deduction of $32,200 for married couples, $16,100 for single filers, and $24,150 for heads of household sets a high threshold that many taxpayers do not exceed through itemized deductions alone. As a result, mortgage interest and property tax deductions only provide additional value when a household’s total eligible expenses surpass that baseline. For many homeowners, this does not occur, meaning the expected tax benefit is either reduced or entirely absent. The key takeaway is that homeownership decisions should not rely on assumed tax advantages. The financial strength of buying a home should be evaluated through affordability, long-term stability, and overall wealth-building potential rather than expectations of automatic tax relief. Understanding how the standard deduction interacts with itemized deductions provides a more accurate foundation for making informed housing decisions. Thank you for taking the time
A 6.65% Mortgage Is Not Just a Rate: What It Does to Your Buying Power

You need to be logged in to view this content. Please Log In. Not a Member? Join Us
Is the Housing Market Finally Becoming a Buyer’s Market?
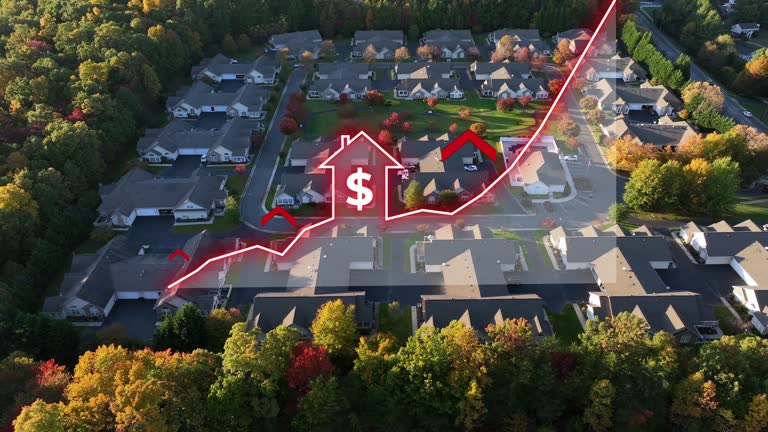
The housing market is no longer moving in a single direction nationwide. Instead, conditions are splitting across regions, price ranges, and inventory levels, creating very different experiences depending on where buyers and sellers are active. In some metropolitan areas, homes are still moving quickly with limited negotiation room. In others, listings are staying on the market longer, price reductions are increasing, and buyers are beginning to regain leverage in ways not seen in several years. One of the clearest indicators of this shift is the broad expansion of buyer-friendly conditions across major metros. Recent market tracking shows that 70% of the 100 largest metropolitan areas are now either leaning toward buyers or actively moving in that direction. That is a significant increase from 52% a year earlier and only 37% in 2019. Even more striking, nearly 19% of those markets are now classified as outright buyer’s markets, with a strong concentration in Southern regions where 18 of those 19 metros are located. These changes reflect more than short-term fluctuation. They point to a structural transition driven by inventory growth, affordability constraints, and slower absorption rates. Understanding how these forces interact provides a clearer view of where negotiation power is shifting and what that means for both sides of a transaction. Expanding Inventory and Slower Market Absorption Inventory has become one of the most important drivers of current housing conditions. After years of tight supply, many metropolitan areas are now experiencing a steady increase in active listings. This shift is changing how quickly homes sell and how aggressively buyers must compete. In several regions, homes are now spending 10 to 20 additional days on the market compared to previous high-demand cycles. Instead of receiving multiple offers within days, properties often remain active long enough for sellers to reassess pricing strategy. This extended exposure naturally increases the likelihood of price reductions, particularly when initial listing prices are set above current market expectations. At the same time, absorption rates have slowed. Fewer homes are being purchased within short timeframes, which allows inventory to accumulate. In practical terms, this means buyers have more comparable options available at any given time, reducing urgency and increasing negotiating power. Housing construction trends also contribute to this environment. While building activity remains present, it is uneven across regions due to financing costs, labor constraints, and developer caution. In some metros, reduced new construction has helped stabilize prices, but in others, resale inventory growth has outpaced demand, contributing to softer conditions. Affordability Pressures Reshaping Demand Mortgage conditions continue to play a central role in shaping buyer behavior. Compared to previous years of historically low borrowing costs, current mortgage rates remain significantly higher, which directly reduces purchasing power across most income levels. Even small fluctuations in interest rates can materially affect affordability. For many buyers, the difference translates into tens of thousands of dollars in reduced borrowing capacity, particularly in mid-range price segments. This has created a more cautious buyer pool, where decisions take longer and comparisons are more detailed. As demand has softened, negotiation activity has increased. Seller concessions such as closing cost assistance, inspection repairs, and price adjustments are becoming more common in several markets. These concessions signal a shift away from competitive bidding environments toward more balanced transaction structures. Price sensitivity has also increased. Homes that remain on the market beyond the typical listing window are more likely to undergo price adjustments. This is especially evident in metros where inventory growth has outpaced buyer demand recovery. Regional Market Divergence and Localized Conditions One of the most defining characteristics of the current housing environment is the lack of uniformity across regions. Instead of a national trend, there are multiple localized markets operating under different conditions at the same time. Nearly 18 of the 19 identified buyer’s markets are concentrated in the Southern region, where inventory expansion has been more pronounced. These areas are experiencing stronger buyer leverage due to higher supply levels relative to demand. Other regions continue to show tighter conditions, particularly where construction is limited or population growth remains strong. However, even in these areas, early signs of moderation are beginning to appear, including longer listing durations and more frequent price adjustments. Key indicators separating market conditions now include: Year-over-year inventory growth exceeding 10% in several metros Days on market extending beyond 45–60 days in softer regions Increasing frequency of price reductions within the first 30 days of listing Sale-to-list price ratios moving closer to equilibrium rather than above asking These indicators highlight that market power is no longer concentrated on one side of the transaction. Instead, it is shifting based on local supply-demand balance. The housing market is moving into a more balanced phase, with clear evidence of buyer-friendly conditions expanding across a growing number of metropolitan areas. With 70% of major markets now leaning toward buyers or shifting in that direction, the environment is increasingly defined by longer listing times, rising inventory, and reduced urgency among buyers. At the same time, conditions remain highly localized. Some regions continue to experience strong demand, while others are seeing meaningful softening. This divergence reinforces the importance of evaluating real estate at the local level rather than relying on national averages. The most important takeaway is that leverage in today’s housing market is fluid. It changes based on timing, pricing strategy, and regional supply conditions. Buyers and sellers who understand these shifts are better positioned to navigate decisions with clarity and confidence. Thank you for taking the time to read and reflect. I write to help people think clearly about money, business, real estate, and life — not from theory, but from decades of lived experience. If you are navigating a financial decision, building a business, considering homeownership, or simply trying to make better use of your time and resources, I invite you to engage further. Subscribe to The Power Is Now TV to connect with me live every weekday, Monday through Friday, from 10:00 AM to 11:00 AM PST, as we record television shows across the