
Home Sales Are Stuck: Why Mortgage Rates Are Controlling the Market

Residential housing activity has entered a phase where transaction volume no longer moves in step with price direction. In many periods, rising prices and rising sales activity tend to align, or falling prices are paired with increased buyer participation. That pattern is no longer consistent. Instead, the current environment reflects a disconnect between pricing stability and slowed sales velocity, creating the impression that the market is stalled even while values remain relatively firm in several regions. Recent national housing data highlights this tension. Existing-home sales declined 1.7% in July, reaching a seasonally adjusted annual pace of 4.06 million units. Despite the monthly decline, sales activity still remained 0.7% higher than the same period a year earlier. At the same time, the national median existing-home price rose to $434,100, reflecting a 2% year-over-year increase. Inventory levels also expanded slightly, reaching approximately 4.6 months of supply, which is generally considered closer to balanced conditions compared to the extremely tight supply seen in previous cycles. These figures reveal an important reality: weak sales volume does not automatically translate into falling prices. Instead, the market is being shaped by a combination of elevated mortgage rates, constrained affordability, and homeowner reluctance to give up historically low financing. Understanding how these forces interact provides clarity on why homes are taking longer to sell and why expectations of a rapid price correction have not materialized in many areas. Mortgage Rates and the Affordability Barrier The most influential factor controlling current housing activity is the cost of borrowing. Mortgage rates remain significantly higher than the levels that fueled previous waves of strong demand. Even small rate changes can have a meaningful impact on monthly payments, particularly for mid-priced homes where affordability margins are already tight. This rate environment has reduced the number of qualified or willing buyers in the market. Instead of broad participation, demand is now more selective, with many potential buyers choosing to delay decisions or adjust price expectations downward. The result is slower absorption of available listings, even in markets where inventory has increased. At the same time, homeowners who locked in lower mortgage rates in previous years are less inclined to sell. Moving would often require taking on a substantially higher borrowing cost, even if the next home is similarly priced. This “rate lock effect” has reduced the number of resale listings entering the market, preventing supply from expanding at a pace that would typically drive sharper price declines. Why Sales Are Slowing Without a Price Collapse A common assumption in cooling markets is that lower sales activity automatically leads to falling home prices. Current conditions challenge that assumption. Even as transaction volume has softened, prices have remained relatively stable, with the national median reaching $434,100 and posting a 2% annual increase. One reason for this stability is constrained supply in key segments. While inventory has improved to roughly 4.6 months nationally, it is still uneven across regions and price tiers. Entry-level and mid-range homes remain relatively limited in many areas, which supports pricing even when demand weakens. Another factor is seller behavior. Many homeowners are not under pressure to sell quickly. Without distress-driven inventory entering the market, pricing tends to adjust more slowly. This creates a situation where homes may take longer to sell, but values do not experience sharp declines unless broader economic conditions shift significantly. The interaction between slower demand and controlled supply results in a market that feels stalled rather than collapsing. Homes remain listed longer, negotiations become more common, and pricing adjustments occur gradually instead of abruptly. Inventory Levels and Market Balance Signals The current inventory level of approximately 4.6 months of supply is an important benchmark. Traditionally, a 4–6 month range is considered a balanced market, where neither buyers nor sellers hold dominant control. However, balance in volume does not always translate into balance in pricing behavior. In some metropolitan areas, inventory is still tight enough to support stable pricing. In others, increased supply combined with weaker demand has created more negotiable conditions. This variation reinforces the importance of local analysis rather than relying solely on national averages. In markets where listings are growing faster than sales, buyers are beginning to see more negotiation flexibility. In contrast, areas with limited new listings continue to support stronger pricing even with slower turnover. This divergence is one of the defining features of the current housing cycle. Why a “Crash Expectation” May Not Align With Current Conditions The idea that slowing sales automatically lead to a significant price collapse does not fully align with current market dynamics. Unlike previous downturns driven by oversupply or distressed selling, today’s environment is shaped more by affordability constraints and financing conditions than by forced liquidation. Homeowners with low fixed mortgage rates are largely staying in place, reducing the volume of motivated sellers. At the same time, lending standards remain more structured compared to earlier high-risk lending periods. These factors limit the type of widespread forced inventory that typically drives sharp price declines. Instead, the market is adjusting through time rather than price acceleration or collapse. Homes stay listed longer, negotiations increase, and price changes occur gradually depending on local demand conditions. This creates a slower-moving correction pattern rather than a rapid downturn. The housing market is currently defined by a clear disconnect between transaction volume and price movement. Existing-home sales have softened to a 4.06 million annualized pace, yet median prices continue to hold above $434,000 with modest annual growth. Inventory has improved to a more balanced level, but mortgage rates and homeowner reluctance to sell remain powerful stabilizing forces. Rather than signaling a collapse, the current environment reflects a market adjusting to higher financing costs and uneven supply conditions. Sales are slowing not because demand has disappeared, but because affordability constraints and rate sensitivity are reshaping buyer participation. At the same time, limited distress and cautious seller behavior are preventing sharp downward pressure on prices. The most important takeaway is that market movement is no longer driven by a single national force. It
San Bernardino County Real Estate Market 2026: Price Stabilization, Logistics-Driven Demand, and Inland Empire Housing Pressure
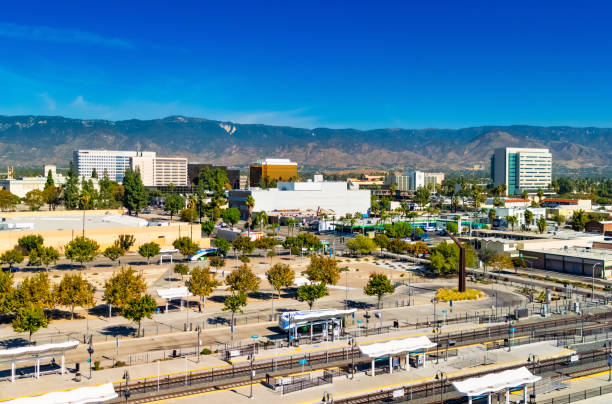
San Bernardino County represents one of the most important affordability-driven housing markets in California, and in many ways, it functions as a key pressure valve for the broader Southern California real estate system. As coastal counties continue to experience elevated pricing and constrained supply, San Bernardino has become a primary destination for households seeking relatively lower-cost homeownership options within commuting distance of major employment centers. By 2026, this dynamic remains firmly in place, but the market is no longer defined by rapid expansion alone; instead, it is shaped by stabilization patterns, shifting affordability thresholds, and a growing dependence on logistics-based economic activity that supports housing demand. What distinguishes San Bernardino County from many other California regions is the combination of large geographic scale, comparatively lower median home values, and steady population growth supported by migration from Los Angeles, Orange County, and even parts of coastal San Diego. However, rising interest rates over recent years have moderated buyer capacity, resulting in slower appreciation and more balanced transaction behavior. While the county is still more affordable than coastal markets, it is not immune to affordability stress, as household income levels struggle to keep pace with long-term housing cost increases. Here’s what’s happening in the San Bernardino County housing market through pricing trends, inventory behavior, transaction activity, and broader economic forces shaping long-term real estate conditions. Pricing Behavior: Mild Decline Within a Long-Term Growth Structure San Bernardino County’s housing market in 2026 is best understood as being in a mild correction-to-stabilization phase rather than a downturn. Recent federal and regional housing data indicate that the median existing single-family home price sits around $500,000 to $548,000 depending on dataset timing and measurement method, reflecting a slight year-over-year decline of approximately 1% or less in some reporting periods. Despite this short-term softening, long-term trends remain strongly positive, with home values increasing significantly over the past decade, driven by population growth and structural demand shifts across Southern California. The key factor influencing pricing behavior is affordability compression. Higher mortgage rates compared to prior ultra-low-rate cycles have reduced purchasing power, effectively placing a ceiling on rapid appreciation. However, there is no evidence of widespread distress selling, which prevents steep declines. Instead, pricing adjusts gradually as sellers recalibrate expectations to match buyer capacity. This creates a controlled environment where values remain historically elevated but move within a tighter and more predictable range. Inventory Conditions: Balanced Supply with Market Fragmentation Inventory in San Bernardino County reflects a more balanced structure compared to coastal California markets, but it is not uniform across all subregions. The county maintains a relatively large housing stock exceeding 700,000 housing units, which allows for a more fluid transaction environment compared to constrained coastal metros. However, the actual absorption of this inventory varies significantly depending on location, price point, and commuter accessibility. In high-demand submarkets closer to employment corridors such as Ontario and Rancho Cucamonga, homes tend to move faster and attract stronger competition. In contrast, more remote inland areas experience longer marketing periods and higher sensitivity to price adjustments. This uneven absorption pattern creates a fragmented inventory landscape where market conditions differ widely within the same county. Overall, the county remains neither oversupplied nor undersupplied, but instead operates in a condition of relative equilibrium with localized pressure points. Transaction Activity: Stable Volume Supported by Regional Migration Despite slower price appreciation, San Bernardino County continues to demonstrate steady transaction activity, supported by ongoing migration from higher-cost California regions. According to regional economic analysis, home sales activity has remained relatively stable in recent cycles, with occasional increases driven by shifts in mortgage rates and affordability windows across the Inland Empire region. This migration-driven demand remains one of the most important structural supports for the housing market. Households moving from coastal counties continue to view San Bernardino as a more attainable entry point into homeownership, particularly for single-family detached housing. However, the intensity of this migration has moderated compared to previous expansion cycles, meaning demand is present but more financially disciplined. Homes that are correctly priced continue to sell within reasonable timeframes, while overpriced listings tend to remain on the market longer, reflecting a more selective buyer pool and reduced urgency in purchase decisions. Economic Influence: Logistics and Housing Interdependence One of the defining features of San Bernardino County is the strong relationship between housing and logistics-driven economic activity. The county serves as a major inland distribution hub for Southern California, with warehousing, transportation, and supply chain operations playing a central role in employment and income stability. This economic base directly supports housing demand by providing steady job creation in sectors that do not require high-cost coastal access. At the same time, this economic structure also introduces volatility sensitivity. When broader economic conditions slow, logistics demand can fluctuate, which in turn affects housing confidence and buyer activity. However, over the long term, the logistics sector continues to provide a consistent employment foundation that supports population retention and gradual housing demand growth. Affordability Pressure: A Long-Term Structural Challenge Although San Bernardino County remains more affordable than Los Angeles or Orange County, affordability pressure is still a significant issue. Recent housing indicators show that household income levels are increasingly strained by rising housing costs, with a growing share of households spending a high proportion of income on housing expenses. Even with lower median home prices relative to coastal counties, entry-level affordability remains challenging for many residents. Rental costs also contribute to this pressure, with rising rents over the past decade limiting the ability of households to transition into homeownership. While there have been short-term stabilizations in rent growth, the long-term trajectory still reflects significant upward pressure, which reinforces the county’s role as both an affordable alternative and a region facing its own internal affordability constraints. San Bernardino County’s real estate market in 2026 reflects a transition into stability after years of expansion and rapid affordability-driven demand. While home prices have softened slightly in some segments, the broader market remains structurally supported by migration from coastal California, logistics-based employment, and
Riverside County Real Estate Market 2026: Inland Expansion, Price Stabilization, and Shifting Buyer Migration Patterns
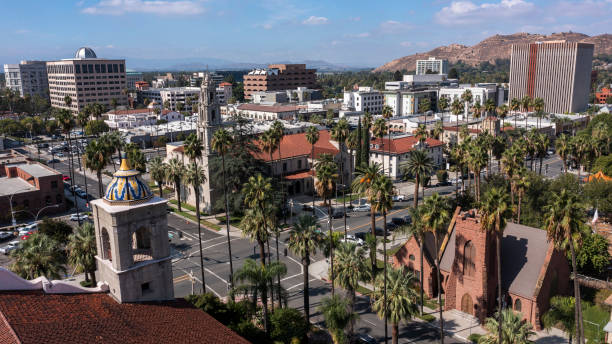
Riverside County continues to play a central role in California’s housing narrative, particularly as affordability pressures push buyers further inland from coastal markets. As part of the Inland Empire, the county has evolved from being viewed primarily as a commuter region into a major residential and logistics-driven housing ecosystem. In 2026, the real estate market reflects a complex balance between steady population growth, moderated pricing, and a shifting demand structure influenced by interest rates and long-term affordability concerns. Unlike coastal California markets where price levels remain extremely high and supply remains tightly constrained, Riverside operates in a more fluid environment where inventory is relatively higher, price adjustments are more visible, and buyer competition fluctuates depending on interest rate sensitivity. Despite this, the county has not experienced a structural downturn. Instead, it is undergoing a normalization phase where price growth has slowed, demand has become more selective, and sellers are adjusting expectations to align with broader economic conditions. This article provides a detailed examination of Riverside County’s 2026 housing market, focusing on pricing behavior, inventory trends, transaction activity, and the evolving role of affordability migration in shaping long-term real estate patterns. Pricing Behavior: Mild Declines Mask a Stabilizing Market Structure Riverside County’s housing market is currently operating within a moderate pricing correction phase rather than a downturn. Recent data places the average home value at approximately $610,000 to $650,000 depending on city and measurement index, reflecting a year-over-year change ranging between -0.1% and -1.1% across different reporting datasets. While this indicates slight softening, the broader structure of the market remains stable when viewed over a multi-year horizon. What is particularly important in Riverside is that pricing adjustments are not driven by distress but by affordability recalibration. Higher borrowing costs have reduced the maximum purchasing power for many households, which in turn has created downward pressure on pricing growth rather than outright price collapse. At the same time, seller equity positions remain relatively strong, preventing forced sales or widespread discounting. This creates a market environment where prices are adjusting at the margins rather than collapsing in segments, reinforcing the idea of stabilization rather than decline. Inventory Conditions: Balanced Supply with Regional Variation Inventory levels in Riverside County remain significantly higher than those found in coastal California markets, which introduces a more balanced dynamic between buyers and sellers. Active listings have ranged from approximately 9,000 to over 13,000 units countywide depending on seasonal cycles and reporting methods. This level of supply gives buyers more choice compared to tighter metropolitan markets such as San Diego or Orange County. However, this does not mean the market is oversupplied. Instead, it reflects a healthy but uneven inventory distribution, where some submarkets experience faster absorption while others linger longer on the market. Well-priced homes in commuter-friendly areas tend to move more quickly, while overpriced listings face extended marketing periods. Median days on market typically range between 30 and 60 days depending on the dataset and location within the county, which signals a market that is neither overheated nor stagnant. This balance is important because it demonstrates that supply and demand are relatively aligned, even if pricing momentum has slowed. Buyer Migration: Inland Movement Continues to Shape Demand One of the defining structural forces in Riverside County is ongoing migration-driven demand from coastal California markets. Many households continue relocating from Los Angeles, Orange County, and San Diego in search of more attainable homeownership opportunities. This migration pattern has been one of the primary drivers of long-term demand stability in the Inland Empire. However, in 2026, this migration effect has become more selective. Instead of broad-based movement, buyers are now highly sensitive to interest rates, job stability, and total monthly housing costs. As a result, demand remains present but less aggressive than in previous expansion cycles. This shift has created a more segmented buyer pool, where entry-level and mid-tier properties attract the most activity, while higher-priced inland homes experience slower absorption. The migration trend remains intact, but its intensity has moderated compared to earlier periods of rapid inland expansion. Pricing Segmentation: Neighborhood-Level Divergence Becomes More Visible Riverside County is increasingly defined by micro-market divergence, where pricing and demand vary significantly across cities and even within neighborhoods. Cities such as Temecula, Corona, and parts of Riverside proper tend to command higher price points, often exceeding $700,000 to $875,000 in certain submarkets, while more affordable areas remain closer to the $450,000 to $600,000 range depending on property type. This divergence reflects differences in school districts, commuter access, housing stock, and buyer preference. It also highlights the growing importance of localized analysis when evaluating Riverside County real estate, as countywide averages often mask significant internal variation. In practical terms, this means two homes in the same county can experience entirely different market conditions based solely on micro-location and price tier positioning. Transaction Activity: Steady Sales Despite Market Cooling Despite slower price appreciation, transaction activity in Riverside County remains relatively strong. Recent data shows year-over-year increases in home sales volume, with thousands of properties continuing to change hands monthly across the county. This indicates that demand has not weakened significantly but has instead adjusted to new pricing and financing conditions. Homes that are priced appropriately continue to attract multiple offers, with a notable percentage still selling at or near list price in competitive segments. However, the proportion of listings requiring price reductions has increased, signaling a more disciplined buyer environment where overpricing is quickly penalized by extended time on market. The overall transaction flow suggests a market that is active, functional, and responsive rather than distressed or stagnant. Riverside County’s real estate market in 2026 reflects a transition toward equilibrium rather than disruption. Prices have softened slightly in some segments, but the broader market remains structurally stable due to continued migration-driven demand and relatively balanced inventory conditions. Buyers now benefit from more options and greater negotiation power, while sellers must adopt more precise pricing strategies to remain competitive. The most important takeaway is that Riverside is no longer defined solely by rapid
San Diego County Real Estate Market 2026: Tight Supply, Strong Demand, and a Two-Speed Housing Economy

San Diego County continues to stand as one of California’s most resilient and consistently competitive housing markets. With a population exceeding 3 million residents and a housing landscape shaped by coastal demand, military stability, biotech expansion, and cross-border economic activity, the county rarely experiences extreme swings in either direction. Instead, it tends to move in controlled cycles defined by inventory availability, interest rate pressure, and localized demand patterns. As of 2026, San Diego’s real estate market is best described as structurally tight but behaviorally selective. Prices have remained elevated, with median home values consistently hovering around the mid-to-high $900,000 range, while inventory levels remain constrained compared to historical norms. At the same time, buyer activity has not disappeared; instead, it has become more strategic, with stronger competition in certain price tiers and slower movement in others. This article examines the current San Diego County housing environment in detail, focusing on pricing behavior, inventory pressure, buyer demand patterns, and the emerging segmentation between property types and price ranges shaping the market today. Pricing Trends: Elevated Values With Narrow Movement San Diego County’s housing market continues to operate at a high baseline price level, with median home values around $934,000 to $952,000 depending on market segment and reporting period . What stands out most is not dramatic appreciation, but the lack of meaningful correction despite broader affordability pressure. Year-over-year price movement has remained relatively flat, ranging from 0% to +3.9% depending on data set and timeframe, showing that the market is neither overheating nor declining sharply . Instead, pricing is stabilizing within a narrow corridor. This stability is largely driven by long-term homeowner equity positions and limited forced selling. Even in higher interest rate conditions, sellers are generally not under distress, which prevents downward pricing spirals. However, affordability constraints are limiting upward momentum, creating a market that is holding value rather than expanding rapidly. Inventory Conditions: Persistent Scarcity Defines Competition One of the most important structural characteristics of San Diego’s housing market is low inventory relative to demand. Active listings remain below long-term historical norms, with approximately 8,000 to 10,000 homes available at any given time depending on seasonal conditions . Months of supply remains firmly in seller-favored territory, typically between 2.5 and 3 months, which indicates a market where demand continues to outpace available housing. Even when new listings enter the market, they are often absorbed quickly, particularly in well-located neighborhoods. Detached single-family homes remain especially constrained, while attached units such as condos and townhomes show relatively more balance. This imbalance creates a two-layer market where property type strongly influences competition levels. The low inventory environment continues to support pricing stability even when buyer demand softens slightly. Buyer Behavior: Competitive but More Calculated Buyer behavior in San Diego County has shifted away from aggressive bidding wars toward more measured and selective purchasing decisions. While competition still exists, especially for well-priced homes in desirable school districts or coastal-adjacent areas, buyers are taking longer to evaluate options. Homes that are correctly priced still move quickly, often going under contract in approximately 20 to 30 days on average . However, overpriced listings tend to remain on the market significantly longer, reflecting a more disciplined buyer pool. Roughly 35% to 40% of homes still sell above list price in competitive segments, showing that demand has not disappeared but has become more targeted. Buyers are now prioritizing value alignment, long-term affordability, and property condition rather than engaging in across-the-board bidding escalation. This shift signals a more rationalized market environment compared to previous peak-cycle behavior. Market Segmentation: A Clear Two-Speed Housing Structure One of the defining features of San Diego County’s 2026 housing market is the emergence of a two-speed structure based on property type and price tier. Detached single-family homes remain highly competitive due to limited supply, with inventory in some periods falling by nearly 25% year-over-year, tightening conditions further in this segment. These properties continue to command stronger pricing power and faster absorption. In contrast, attached properties such as condos and townhomes show more balance, with inventory levels stabilizing and months of supply approaching more neutral conditions. This segment experiences longer marketing times and fewer bidding scenarios. Price tier performance also varies significantly. Mid-tier homes continue to attract the strongest demand, while lower-tier housing experiences longer days on market and more price sensitivity. Luxury properties maintain stability but move at a slower pace, reflecting selective buyer behavior. This segmentation has become one of the most important dynamics shaping transaction outcomes in the county. Transaction Activity and Market Flow Despite affordability challenges, San Diego County continues to show healthy transaction volume, with thousands of monthly sales occurring across all property types. Recent data indicates year-over-year growth in closed sales and pending transactions in several reporting periods, suggesting sustained market activity rather than stagnation. Homes that are priced appropriately continue to sell within a reasonable timeframe, while the overall pace of the market remains steady rather than accelerated. This indicates a market that is functioning normally, but under tighter financial constraints for buyers. The balance between supply compression and steady demand has prevented sharp price declines, even as interest rate conditions reduce purchasing power. San Diego County’s real estate market in 2026 reflects a stable but structurally constrained environment. Prices remain elevated but largely flat, inventory continues to sit below historical norms, and buyer activity remains selective rather than aggressive. The most important takeaway is the increasing segmentation of the market, where property type and price tier now determine competition levels more than broad market conditions. For buyers, patience and precise targeting are essential in navigating this environment. For sellers, strategic pricing is critical to avoid extended time on market. Investors and analysts should focus on micro-market differences rather than countywide averages, as conditions vary significantly between detached homes, attached units, and pricing tiers. Thank you for taking the time to read and reflect. I write to help people think clearly about money, business, real estate, and life — not from theory, but from decades of
Orange County Real Estate Market 2026: High-Value Stability, Tight Inventory, and a Selective Buyer Environment
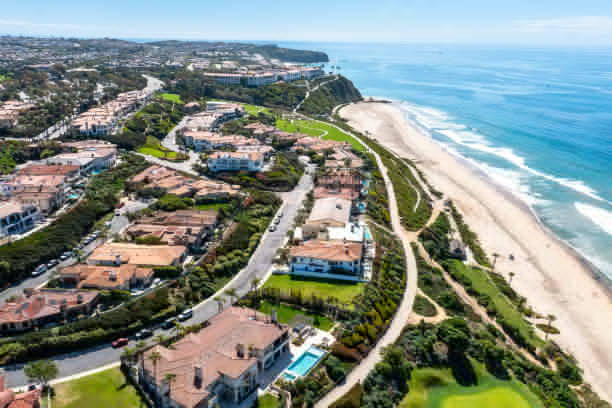
Orange County continues to stand as one of California’s most stable and high-value real estate markets, characterized by strong household incomes, consistent demand, and a long-standing reputation for residential desirability. Unlike more volatile regions, this county often moves at a measured pace, where pricing shifts are gradual and buyer behavior tends to be more financially conservative. In 2026, the housing landscape reflects a market that is neither sharply accelerating nor declining, but instead adjusting within a narrow band of equilibrium shaped by affordability constraints and limited supply. What makes Orange County particularly distinct is the balance between its coastal luxury markets and its highly structured suburban communities. This balance creates a layered housing ecosystem where price sensitivity varies significantly across neighborhoods. As mortgage rates remain elevated compared to historical lows, buyers are increasingly selective, while sellers are holding firm on pricing expectations due to long-term equity positions. This article breaks down the current Orange County real estate environment, focusing on pricing behavior, inventory conditions, buyer demand, and the evolving structure of transactions shaping the 2026 market cycle. Market Pricing Behavior: Stability Within a High-Cost Corridor Orange County’s housing market continues to operate within one of the highest price brackets in California, with median home values consistently exceeding $1.0 million in many submarkets. While price appreciation has slowed compared to previous cycles, the region has not experienced meaningful depreciation. Instead, the market is defined by price flattening and narrow movement ranges, where most annual changes remain within low single-digit percentages. Recent county-level data shows that median sold prices have remained relatively steady, reflecting a market that is absorbing higher borrowing costs without significant downward corrections. The persistence of elevated pricing is largely supported by long-term homeowners with substantial equity positions, reducing the urgency to sell under less favorable conditions. However, pricing behavior is not uniform. Coastal areas such as Newport Beach and Laguna Beach continue to demonstrate strong resistance to price softening, while inland submarkets show more negotiation flexibility. This creates a segmented pricing environment where micro-location matters more than broad countywide trends. Inventory Conditions: Limited Supply Continues to Shape Competition One of the defining characteristics of the Orange County housing market is its structurally constrained inventory. The number of active listings remains below historical norms, with supply levels typically ranging between two to three months of inventory, depending on seasonal cycles. This limited availability continues to support price stability, even in the presence of softer demand conditions. Many homeowners are reluctant to list properties due to the “lock-in effect,” where existing low mortgage rates discourage movement. As a result, turnover remains low, reinforcing scarcity in both entry-level and mid-tier housing segments. Properties that do enter the market tend to attract immediate attention if they are correctly priced. Homes in well-established school districts and commuter-friendly corridors often move faster than the county average, while overpriced listings remain on the market significantly longer. This dynamic highlights a market where pricing precision is becoming more important than ever. Buyer Behavior: Selectivity Over Aggression Buyer behavior in Orange County has shifted noticeably toward selective purchasing rather than competitive bidding wars. While demand remains structurally strong, the urgency seen in prior years has diminished due to affordability pressures and higher borrowing costs. Many buyers are now prioritizing value alignment over speed, spending more time evaluating comparable properties and negotiating price adjustments. This has led to a rise in conditional offers and longer decision timelines, particularly in mid-range housing segments. However, well-positioned properties in desirable neighborhoods continue to attract multiple offers. This indicates that demand has not weakened uniformly, but rather become more concentrated around specific price points and property characteristics. The result is a market where competition exists, but only within tightly defined segments. Market Segmentation: Diverging Performance Across Price Tiers Orange County’s real estate market is increasingly defined by tier-based performance differences. High-end luxury properties maintain relative stability due to wealth concentration and low sensitivity to interest rate fluctuations. Meanwhile, starter and mid-tier homes face more pricing pressure as affordability becomes a limiting factor for many households. Luxury segments continue to see steady transaction volume, supported by equity-rich buyers and cash transactions. Mid-tier properties experience moderate appreciation or flat pricing, depending on location and condition. Entry-level housing, however, is more sensitive to economic shifts, with longer days on market and increased negotiation activity. This segmentation reflects a broader structural shift in California housing markets, where affordability constraints are reshaping demand distribution across price bands rather than causing uniform market movement. Rental Market Influence and Housing Pressure The rental market in Orange County plays a significant role in shaping homeownership demand. Median rents remain among the highest in the state, frequently exceeding $2,800 to $3,500 per month depending on submarket and unit type. This sustained rental pressure continues to push long-term renters toward homeownership when financially feasible. However, elevated home prices and higher mortgage costs have slowed this transition. As a result, rental demand remains strong, particularly among younger households and relocating professionals. The interaction between high rental costs and constrained ownership affordability creates a dual-pressure environment, where both rental and purchase markets remain competitive, albeit for different reasons. Orange County’s real estate market in 2026 reflects a landscape defined by stability, segmentation, and constrained supply. While price growth has slowed, the market has not entered a downturn. Instead, it is operating within a narrow band of equilibrium shaped by affordability limits and strong long-term equity positions. For buyers, success in this market depends on timing, financial readiness, and precise property targeting. For sellers, accurate pricing and market positioning are essential, as overpricing can quickly reduce visibility in a selective buyer environment. Investors and market observers should focus less on broad countywide trends and more on neighborhood-level performance differences. Thank you for taking the time to read and reflect. I write to help people think clearly about money, business, real estate, and life — not from theory, but from decades of lived experience. If you are navigating a financial decision, building a business, considering
Los Angeles County Real Estate Market 2026: Cooling Prices, High Demand, and a Balanced but Competitive Housing Landscape

Los Angeles County remains one of the most closely watched real estate markets in the United States, not only because of its size but also because of its influence on broader California housing trends. With nearly 10 million residents and a housing market that ranges from ultra-luxury coastal estates to dense urban housing corridors, the county continues to reflect both opportunity and pressure for buyers, sellers, and investors. As of mid-2026, the Los Angeles housing market is showing signs of stabilization after several years of volatility. Price growth has slowed significantly, inventory levels have increased, and buyers are seeing slightly more negotiating room compared to the peak competitive cycles of recent years. At the same time, demand remains structurally strong due to population density, employment concentration, and limited long-term housing supply elasticity. This article provides a detailed breakdown of the current Los Angeles County real estate environment, including pricing trends, inventory conditions, market behavior, and buyer-seller dynamics shaping decisions in 2026. Market Overview: Pricing and Stability Signals The Los Angeles County housing market is currently in a phase of price stabilization rather than rapid appreciation or decline. The average home value sits around $885,000, reflecting a modest annual increase of approximately 0.4% year-over-year. Recent transaction data shows the median sale price hovering near $907,000 to $947,000, depending on the reporting period, indicating a relatively narrow pricing band across the county’s diverse submarkets. This stability is significant because it reflects a shift away from aggressive bidding cycles seen in previous years. Instead, pricing is now being shaped by affordability constraints, higher borrowing costs compared to historical lows, and more cautious buyer behavior. While prices are not declining sharply, growth has clearly slowed, suggesting a market that is recalibrating rather than expanding rapidly. Inventory Conditions and Buyer Leverage One of the most important real estate shifts in Los Angeles County is the rise in available inventory. The county currently reports approximately 19,000 to 30,000 active listings depending on data source and timeframe, signaling a notable increase in housing supply compared to prior years. Homes are also taking longer to sell, with median days on market ranging between 23 and 49 days, depending on property type and location within the county. This shift creates a more balanced environment where buyers have increased leverage in negotiations. While competitive bidding still exists in premium neighborhoods and well-priced listings, the overall pace of transactions has slowed. Sellers are more frequently adjusting listing prices or offering concessions to attract qualified buyers. The increase in inventory also suggests that demand is not collapsing but rather normalizing after periods of constrained supply. Pricing Pressure and Market Cooling Patterns Despite overall stability, Los Angeles County is experiencing localized pricing pressure, particularly in mid-tier housing segments. Data shows a slight decline in median listing prices of around 4% to 7% year-over-year in some datasets, reflecting softening demand at higher price points. This cooling is largely driven by affordability constraints. Many households are priced out of traditional ownership pathways due to high mortgage costs combined with elevated home prices that remain significantly above national averages. However, the market is not experiencing uniform decline. Luxury areas such as coastal Los Angeles and high-demand neighborhoods continue to maintain strong price resilience, while entry-level and mid-tier segments show more sensitivity to economic conditions. This divergence highlights a fragmented market rather than a uniform downturn. Demand Dynamics and Transaction Activity Even with cooling price growth, transaction activity remains relatively strong. Recent data indicates that home sales have increased year-over-year in certain periods, with thousands of monthly transactions still occurring across the county. Approximately 40% to 45% of homes still sell above list price in competitive segments, demonstrating that demand has not disappeared—it has simply become more selective and price-sensitive. Buyers are increasingly focused on value, condition, and location-specific advantages rather than engaging in broad bidding wars. As a result, properly priced homes in desirable areas continue to move quickly, while overpriced listings tend to linger. This selective demand environment is one of the defining characteristics of the current market cycle. Rental Market Influence on Housing Pressure The rental market in Los Angeles County continues to play a major role in shaping homeownership demand. Median rents are approximately $3,000 to $3,200 per month, depending on location and property type. Although rental growth has softened slightly year-over-year, affordability remains a challenge. High rental costs continue to push long-term renters toward homeownership when financially possible, even in a higher interest rate environment. However, many households remain in the rental sector longer due to down payment constraints and stricter lending conditions. This dynamic creates sustained pressure on rental inventory while indirectly supporting long-term housing demand. Los Angeles County’s real estate market in 2026 is best described as balanced but highly segmented. Prices are no longer rising aggressively, yet they are not declining in a meaningful way across the board. Instead, the market is adjusting to new affordability realities, higher inventory levels, and more selective buyer behavior. For buyers, this environment presents improved negotiation opportunities compared to previous years. For sellers, pricing strategy has become more critical than ever, as overpricing can lead to extended time on market. Investors and market participants must now focus more on micro-location trends rather than countywide averages. Thank you for taking the time to read and reflect. I write to help people think clearly about money, business, real estate, and life — not from theory, but from decades of lived experience. If you are navigating a financial decision, building a business, considering homeownership, or simply trying to make better use of your time and resources, I invite you to engage further. Subscribe to The Power Is Now TV to connect with me live every weekday, Monday through Friday, from 10:00 AM to 11:00 AM PST, as we record television shows across the Power Is Now TV Network. As a subscriber, you can participate in live tapings, engage in real-time discussions, and connect directly with industry leaders. Visit ThePowerIsNow.com to access real estate magazines, books,
When the Top Holds the Market: How Luxury Sales Are Masking Weakness in Los Angeles County Housing

In Los Angeles County, headline housing numbers continue to suggest resilience. Median home prices remain elevated, year-over-year declines have been modest, and total transaction values still point to a market that appears intact. Yet beneath those surface-level indicators lies a more uneven reality. The strength seen across the county is increasingly concentrated at the very top of the market, where high-value transactions are doing much of the heavy lifting. While multimillion-dollar homes continue to close at steady or even rising prices, entry-level and mid-tier buyers are encountering a very different environment. Elevated mortgage rates, limited inventory in affordable price bands, and stretched household incomes have reduced participation among first-time and moderate-income buyers. The result is a housing market that looks stable in aggregate but is narrowing in its base of activity. This article examines how luxury home sales are sustaining overall market performance in Los Angeles County, contrasts activity across price segments, and considers the risks that could emerge if high-end demand begins to soften. Luxury Strength vs. Entry-Level Contraction At the upper end of the Los Angeles County housing market, defined broadly as homes priced above $2 million, transaction activity has shown notable resilience. In 2025, luxury sales volumes in the county declined by approximately 3% year-over-year, a modest contraction compared to sharper drops in lower price tiers. More importantly, median prices in this segment rose between 5% and 8%, with prime neighborhoods recording even stronger gains. In areas such as Beverly Hills and Malibu, median luxury prices exceeded $4.5 million, with select properties closing above $10 million. By contrast, the entry-level market—typically homes priced below $750,000—has experienced a more significant slowdown. Sales volumes in this segment fell by roughly 18% year-over-year, reflecting reduced affordability and limited supply. The median price for entry-level homes in Los Angeles County has climbed to approximately $680,000, requiring a monthly mortgage payment of around $4,200 at a 6.75% interest rate with a 10% down payment. For many households, this exceeds recommended affordability thresholds, particularly as median household income in the county stands near $76,000. This divergence has created a market imbalance. While luxury buyers, often less dependent on financing, continue to transact, entry-level buyers—who traditionally form the foundation of housing demand—are increasingly sidelined. Pricing Power Concentrated at the Top One of the clearest indicators of this imbalance is the distribution of price growth across different tiers. Countywide median home prices have increased approximately 4% over the past year, reaching nearly $890,000. However, this figure is heavily influenced by high-value transactions. In the luxury segment, price per square foot has risen to an average of $1,200, with some submarkets exceeding $1,800 per square foot. Meanwhile, in more affordable areas of the county, price growth has stagnated or even declined slightly, with increases limited to 1% to 2% in many neighborhoods. Inventory trends further highlight the disparity. Luxury inventory has expanded by about 12% year-over-year, giving high-end buyers more choices without significantly weakening prices. In contrast, entry-level inventory remains constrained, with active listings down approximately 9% compared to the previous year. This shortage prevents prices from falling meaningfully but also suppresses transaction volume, as fewer homes are available for purchase. The result is a concentration effect: overall market strength is being driven by a relatively small number of high-value transactions. In 2025, homes priced above $2 million accounted for nearly 38% of total dollar volume in Los Angeles County, up from 29% just three years earlier. This shift underscores how dependent the broader market has become on its most affluent participants. The Risk of a Luxury Slowdown The current structure of the market introduces a clear vulnerability. If demand at the high end weakens, the impact on overall market performance could be disproportionate. Luxury buyers are often influenced by factors beyond local housing conditions, including stock market performance, interest rate expectations, and global economic trends. A downturn in financial markets or a shift in wealth sentiment could quickly reduce activity in this segment. Should luxury sales decline significantly—by, for example, 10% to 15%—the effect on median price metrics would likely be immediate. With fewer high-value transactions, the countywide median price could drop even if lower-tier prices remain stable. This would create the appearance of a broad market correction, even though the underlying issue is concentrated at the top. At the same time, the entry-level market is not positioned to compensate for such a slowdown. Affordability constraints remain severe, with mortgage rates hovering between 6.5% and 7%, and wage growth lagging behind housing costs. Without meaningful increases in supply or reductions in borrowing costs, entry-level demand is unlikely to rebound quickly. This combination—a top-heavy market with limited participation at the base—raises questions about long-term stability. Housing markets typically rely on a broad spectrum of buyers to sustain consistent activity. When that base narrows, volatility tends to increase. Los Angeles County’s housing market is not as uniformly strong as headline numbers suggest. Beneath steady median prices and high transaction values lies a market increasingly reliant on luxury buyers to maintain momentum. High-end sales have provided a cushion, supporting price growth and masking weakness in more affordable segments. However, this concentration carries risk. If luxury demand slows due to broader economic pressures, the effects could ripple quickly through market indicators, exposing the fragility of current conditions. At the same time, entry-level buyers remain constrained by affordability challenges, limiting the market’s ability to rebalance organically. For policymakers, investors, and industry professionals, the takeaway is clear: a healthy housing market requires participation across all price tiers. Until entry-level accessibility improves, Los Angeles County will continue to depend on its most expensive homes to sustain the appearance of stability—a position that may not hold indefinitely. Eric Lawrence Frazier Advisory Services Research Team Thank you for taking the time to read and reflect. I write to help people think clearly about money, business, real estate, and life — not from theory, but from decades of lived experience. If you are navigating a financial decision, building a business, considering homeownership, or simply
The Stability Trap: Why Flat Home Prices in Orange County Signal Constraint, Not Balance
In Orange County, housing market headlines in 2026 suggest a sense of calm. Median home prices have shown minimal movement over the past 12 months, hovering near $1.25 million with year-over-year changes fluctuating between -1% and +2%. On the surface, this appears to indicate a balanced market—one where supply and demand have reached equilibrium after years of volatility. However, a closer examination reveals a different reality. Stability in pricing is not being driven by healthy market conditions, but by a combination of restricted inventory, suppressed transaction volume, and behavioral shifts among homeowners. The market is not actively functioning at full capacity; instead, it is constrained, with both buyers and sellers limited in their ability to participate. This distinction is critical. A balanced market reflects active engagement from both sides, while a constrained market reflects inactivity masked as stability. In Orange County, the evidence increasingly points to the latter, where flat prices are less a sign of equilibrium and more a reflection of underlying structural pressure. Low Inventory, But Not for the Right Reasons Housing inventory in Orange County remains historically low, but the reasons behind this shortage are not tied to strong demand alone. As of early 2026, active listings are down approximately 22% compared to pre-pandemic levels and about 11% lower than the same period in 2024. At the same time, new listings entering the market have declined by nearly 15% year-over-year. Under normal market conditions, low inventory would signal strong competition among buyers, often leading to upward pressure on prices. However, in the current environment, demand itself has weakened. Closed sales volume in Orange County dropped by approximately 18% in 2025 compared to 2023 levels, indicating fewer completed transactions despite limited supply. This combination—low inventory alongside declining sales—points to a market where activity is constrained on both sides. Buyers are limited by affordability challenges, while sellers are choosing not to list. The result is a reduced number of transactions, which in turn stabilizes prices artificially. Without sufficient turnover, price discovery becomes limited, and median values remain relatively unchanged. The Lock-In Effect and Seller Inactivity One of the most significant forces shaping the Orange County housing market is the “lock-in effect.” Between 2020 and 2022, millions of homeowners secured mortgage rates between 2.5% and 3.5%. In contrast, mortgage rates in 2026 remain between 6.5% and 7%, more than double those earlier levels. For a typical Orange County homeowner with a $900,000 mortgage at 3%, the monthly principal and interest payment is approximately $3,800. If that same homeowner were to sell and purchase a similarly priced home at today’s rates, their payment would increase to roughly $6,300—an increase of $2,500 per month, or $30,000 annually. This financial disincentive has led to a sharp decline in seller participation. Nearly 72% of mortgage holders in California currently have rates below 4%, making them highly unlikely to move unless necessary. As a result, many potential sellers are effectively locked into their existing homes, reducing the number of listings available in the market. This behavior has a direct impact on pricing. With fewer homes available for sale, there is less downward pressure on prices, even as buyer demand weakens. Stability, in this context, is not a reflection of strong market fundamentals but of limited mobility. Weak Transaction Volume and Suppressed Demand While inventory constraints limit supply, affordability challenges continue to suppress demand. At a median home price of $1.25 million, a buyer putting down 20% would need to finance approximately $1 million. At a 6.75% mortgage rate, this results in a monthly payment of around $6,500 for principal and interest alone. Adding property taxes—approximately 1.1%, or $13,750 annually—and insurance costs of about $300 per month brings the total monthly housing cost to nearly $7,950. Using a 30% debt-to-income ratio, a buyer would need to earn approximately $318,000 annually to qualify for this purchase. This requirement far exceeds the county’s median household income of roughly $110,000. Even households earning $200,000 annually fall short of standard qualification thresholds, particularly when accounting for other debts. The result is a shrinking pool of eligible buyers. While demand still exists in theory, it is not translating into transactions. This disconnect between interest and ability further reduces market activity, reinforcing the appearance of stability. Stability as a Symptom of Constraint In a fully functioning market, prices adjust in response to changes in supply and demand. If demand weakens significantly, prices typically decline to restore balance. However, in Orange County, this adjustment mechanism is being disrupted by structural constraints. Low inventory prevents prices from falling, while weak demand prevents them from rising. The market becomes effectively frozen, with limited movement in either direction. Median price stability, therefore, reflects a lack of transactional depth rather than a healthy equilibrium. This dynamic can persist for extended periods, but it carries risks. If external factors—such as rising unemployment, economic slowdown, or increased inventory from distressed sales—introduce new supply into the market, prices could adjust more rapidly than expected. Without a strong base of active buyers, the market may have limited capacity to absorb such changes smoothly. Orange County’s housing market in 2026 presents a clear example of how stability can be misleading. Flat home prices suggest balance, but the underlying conditions tell a different story. Inventory remains low not because of strong demand, but because sellers are holding onto low-rate mortgages. At the same time, transaction volume has declined as buyers struggle to meet increasingly high qualification thresholds. This combination has created a constrained market where activity is limited, and price movement is muted. Stability, in this case, is not a sign of health—it is a symptom of restriction. For industry professionals and policymakers, the key takeaway is that true market balance requires active participation from both buyers and sellers. Until affordability improves and mobility increases, Orange County’s housing market will remain stable in appearance, but structurally imbalanced beneath the surface. Eric Lawrence Frazier Advisory Services Research Team Thank you for taking the time to read and reflect. I write to help people
The 30-Day Market Lag: Why Riverside County Homes Are Slower to Move Despite “Hot Market” Conditions
A “hot market” used to be defined by speed. Listings would appear and disappear within days, often with multiple offers pushing prices higher almost immediately. That rhythm has changed in Riverside County. In 2026, homes are still selling, prices are still elevated, and demand has not disappeared—but the pace has shifted in a way that changes the entire meaning of market strength. Across much of the county, the average home now sits on the market for 30 to 40 days or longer before going into contract. In some submarkets, particularly in mid-tier price ranges, the timeline stretches even further depending on condition, pricing strategy, and financing requirements. What was once a 7–14 day market has evolved into a slower, more deliberate environment where buyers are no longer rushing to compete. This change is not simply a matter of seasonal fluctuation. It reflects a deeper behavioral shift in how buyers approach decision-making, risk, and affordability. The market has not cooled in the traditional sense, but it has lost its urgency—and that loss is reshaping how transactions unfold. From Competition to Consideration One of the clearest changes in Riverside County is the decline of bidding pressure. In previous cycles, particularly during the 2020–2022 surge, homes in desirable price ranges frequently received multiple offers within days of listing. Escalation clauses, waived contingencies, and above-asking-price offers were common. In 2026, that pattern has largely faded. Instead of competing aggressively, buyers are taking a more measured approach. Homes priced between $550,000 and $800,000—historically one of the most active segments—are now averaging 28 to 35 days on market before receiving acceptable offers. Properties above $800,000 often extend beyond 40 days unless they are aggressively priced or recently renovated. This shift is tied directly to financing conditions. With mortgage rates remaining between 6.5% and 7%, monthly payment sensitivity has increased significantly. A difference of $25,000 in purchase price can translate into meaningful monthly payment changes, prompting buyers to evaluate listings more cautiously rather than reacting quickly. The result is a market where urgency has been replaced by analysis. Buyers are no longer driven by fear of missing out; they are driven by fear of overpaying in a high-rate environment. The 30–40 Day Reset: A New Normal The current average days on market in Riverside County reflects a structural reset rather than a temporary slowdown. Homes that once moved in under two weeks now routinely require 30 to 45 days to secure a buyer. This extended timeline is not necessarily a sign of weakness in demand. Instead, it reflects a redistribution of decision-making power. Buyers now have more time to compare options, review financing scenarios, and wait for price adjustments before committing. Even well-presented homes are no longer immune to this slower cadence. Data from county-level transaction patterns shows that price reductions are becoming more common before sale. A growing share of listings—estimated at nearly 38% in 2025—required at least one price adjustment before entering escrow. This reinforces the idea that initial list prices are increasingly being tested by a more selective buyer pool. In practical terms, the “hot market” label no longer applies to speed. It now applies only to price resilience, not transaction velocity. Selectivity Over Urgency A defining feature of the current market is increased buyer selectivity. Rather than competing for limited inventory, buyers are filtering aggressively based on condition, location, and monthly payment impact. Homes requiring even minor updates are experiencing longer marketing periods, while turnkey properties closer to employment centers continue to perform relatively better. However, even well-positioned homes are not escaping the broader slowdown in urgency. This shift is also influenced by economic uncertainty. Household budgets are more sensitive to interest rate fluctuations, insurance costs, and property tax increases than in previous cycles. As a result, buyers are less willing to stretch beyond comfortable payment thresholds, even in competitive submarkets. The psychological shift is equally important. The expectation that “if you don’t act today, you’ll lose the home” has weakened considerably. That change alone has slowed the entire transaction cycle. What Slower Movement Really Signals Longer days on market are often interpreted as a cooling signal, but in Riverside County, the reality is more complex. Prices have not collapsed, and demand has not disappeared. Instead, the market has transitioned into a state where friction has increased at every stage of the transaction process. Sellers are still anchored to recent peak pricing expectations, while buyers are anchored to monthly payment constraints. The gap between those two positions is not large enough to create widespread price declines, but it is large enough to slow decision-making significantly. This creates a market where equilibrium is achieved not through price adjustment, but through time. Homes take longer to sell because neither side is willing or able to move quickly enough to force resolution. Riverside County’s housing market in 2026 is not defined by decline, but by delay. The 30-day average selling window represents more than a statistical shift—it reflects a change in behavior, expectations, and financial reality. The traditional meaning of a “hot market” no longer applies. Speed has been replaced by caution, urgency has been replaced by evaluation, and competition has been replaced by selectivity. Until interest rates ease or affordability improves, the market is likely to continue operating in this slower rhythm. Not because demand has vanished, but because the conditions required for rapid transactions no longer exist at scale. Eric Lawrence Frazier Advisory Services Research Team Thank you for taking the time to read and reflect. I write to help people think clearly about money, business, real estate, and life — not from theory, but from decades of lived experience. If you are navigating a financial decision, building a business, considering homeownership, or simply trying to make better use of your time and resources, I invite you to engage further. Subscribe to The Power Is Now TV to connect with me live every weekday, Monday through Friday, from 10:00 AM to 11:00 AM PST, as we record television shows across the Power Is
The Employment Paradox: Why San Bernardino County’s Job Growth Isn’t Translating Into Homeownership
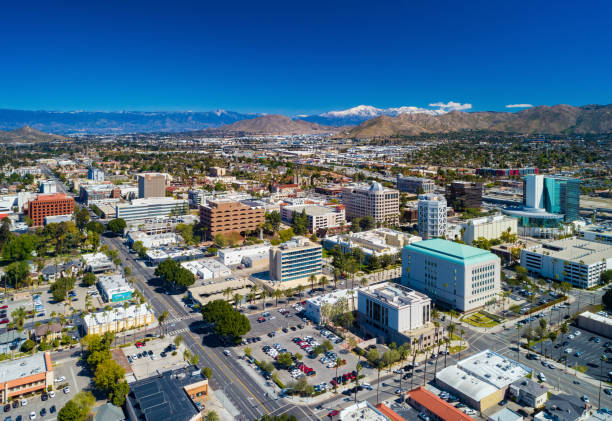
Economic expansion is often expected to bring housing stability. When jobs increase, wages rise, and new industries take root, homeownership typically follows. In San Bernardino County, that relationship is breaking down. The county has become one of California’s most active logistics hubs, driven by warehouse expansion, distribution centers, and transportation-linked employment growth. Yet despite this job creation, homeownership remains increasingly out of reach for a large share of the workforce. The contradiction is becoming more visible: employment is rising, but housing access is not improving at the same pace. Workers filling essential logistics roles are often earning wages that do not align with local housing costs, especially as prices and borrowing expenses remain elevated. This creates a structural disconnect between economic activity and residential stability. Understanding this gap requires looking beyond job numbers alone. It involves examining wage structures, housing prices, and the financial thresholds required to qualify for ownership in a market where employment growth does not automatically translate into affordability. Logistics Expansion and Job Growth Concentration San Bernardino County has become a central node in the national logistics network. Supported by its geographic position and access to major transportation corridors, the county has seen significant growth in warehousing, distribution, and freight-related employment over the past decade. Major logistics parks and fulfillment centers have expanded across cities such as Ontario, Fontana, and Rialto, bringing thousands of jobs into the region. In recent years, logistics-related employment has accounted for a substantial portion of new job creation, with warehouse and transportation roles representing one of the fastest-growing employment categories in the county. However, much of this growth is concentrated in hourly wage positions. While these jobs provide steady employment, they do not typically offer income levels aligned with Southern California housing costs. The result is a labor market that is expanding in size but not in purchasing power. Wage Reality vs. Housing Costs The core issue in San Bernardino County is not employment availability—it is wage alignment. Many logistics and warehouse positions in the region pay between $18 and $25 per hour, depending on role, experience, and employer. On an annual basis, this translates to approximately $37,000 to $52,000 for full-time workers. At the same time, median home prices in the county have risen significantly, with many areas now ranging between $500,000 and $650,000. Even with moderate price variation across submarkets, the income required to qualify for a home purchase far exceeds what most logistics workers earn. For example, a $550,000 home with a 20% down payment results in a loan of $440,000. At a 6.75% mortgage rate, monthly principal and interest payments alone are approximately $2,850. After adding property taxes, insurance, and maintenance, total monthly housing costs can reach $3,600 or more. To qualify under standard lending guidelines, a household would generally need to earn between $130,000 and $150,000 annually. This is nearly three times the income of many logistics workers in the region. Even dual-income households working in similar wage brackets often fall short of the threshold required for mortgage approval. The Structural Barrier to Homeownership The disconnect between wages and housing prices creates a structural barrier that cannot be resolved through employment growth alone. While job creation improves economic activity, it does not automatically improve housing access when wages remain static relative to property values. In San Bernardino County, this barrier is reinforced by several factors. First, housing supply remains constrained in affordable segments, limiting entry-level options. Second, rising interest rates have increased monthly payment requirements, effectively raising the income threshold for qualification. Third, competition from higher-income buyers and investors in certain submarkets has placed additional upward pressure on prices. These combined forces create a situation where working in the county does not guarantee the ability to live in it as a homeowner. Many workers commute long distances from more affordable inland or desert communities, further separating employment centers from residential ownership opportunities. A Growing Divide Between Economic Output and Housing Access The logistics sector contributes significantly to San Bernardino County’s economic output, yet the benefits are not evenly distributed in terms of housing access. Employment growth has strengthened the county’s role in regional and national supply chains, but housing affordability has not kept pace with this expansion. This disconnect is visible in homeownership rates, which remain below statewide averages in several working-class communities within the county. It is also reflected in rental demand, which continues to increase as more workers remain unable to transition into ownership. The broader implication is that job growth alone is no longer a sufficient indicator of housing stability. Without corresponding wage growth or more affordable housing development, economic expansion can coexist with housing strain rather than alleviate it. San Bernardino County’s housing market highlights a growing structural imbalance in modern regional economies. While logistics and warehouse employment continues to expand, the income generated by these jobs is not enough to support homeownership under current market conditions. The result is a clear separation between work and ownership: people are increasingly employed within the county but unable to afford to live there as homeowners. Rising prices and higher financing costs have widened this gap, reinforcing a system where economic growth does not automatically translate into residential access. Until wage growth, housing supply, or financing conditions shift in a meaningful way, the divide between logistics-driven employment and housing affordability is likely to persist. Eric Lawrence Frazier Advisory Services Research Team Thank you for taking the time to read and reflect. I write to help people think clearly about money, business, real estate, and life — not from theory, but from decades of lived experience. If you are navigating a financial decision, building a business, considering homeownership, or simply trying to make better use of your time and resources, I invite you to engage further. Subscribe to The Power Is Now TV to connect with me live every weekday, Monday through Friday, from 10:00 AM to 11:00 AM PST, as we record television shows across the Power Is Now TV Network. As a subscriber, you