
High-Income Markets Under Pressure—Are Orange County Buyers Overleveraged in 2026?

Orange County has long been viewed as one of California’s most stable and desirable housing markets. With its coastal cities, strong school districts, and high household incomes, it has consistently attracted professionals, business owners, and long-term investors. However, beneath the surface of this premium market, financial pressure is beginning to build in ways that are less visible but increasingly significant. Over the past few years, home prices in Orange County have continued to climb, even as interest rates have remained elevated. Median home prices now regularly exceed $1.1 million, while monthly mortgage payments for new buyers often range between $5,500 and $7,500 depending on down payment size and loan structure. At the same time, wage growth has not kept pace with housing costs, creating a widening gap between income and affordability. This imbalance raises an important question: are buyers in Orange County becoming overleveraged in 2026? Understanding how financing conditions, debt ratios, and market behavior are evolving provides critical insight into the sustainability of one of California’s most competitive housing markets. This article examines current affordability pressures, financing trends, and the financial risks shaping buyer behavior across the county. Rising Home Prices and Affordability Strain Orange County remains one of the most expensive housing markets in the United States. As of 2025–2026, the median home price sits between $1.05 million and $1.2 million, depending on the data source and submarket. Coastal cities such as Newport Beach, Laguna Beach, and Huntington Beach regularly exceed $1.5 million for single-family homes, with luxury properties far surpassing that range. Even inland cities like Irvine, Tustin, and Anaheim have seen significant appreciation over the past decade. Irvine, for example, now frequently records median prices above $1.3 million for detached homes. This sustained price growth has outpaced household income increases, which have grown at a much slower rate of approximately 3% to 4% annually. As a result, affordability has become increasingly constrained. A household earning $200,000 annually—which is considered high income in most parts of the country—now often qualifies for only a mid-tier home in Orange County, depending on debt levels and down payment capacity. Financing Pressures and Debt-to-Income Ratios One of the most important indicators of buyer stress in Orange County is the debt-to-income (DTI) ratio. Lenders typically prefer a DTI below 43%, but many buyers in the region are stretching close to or above this threshold due to high monthly housing costs. With interest rates hovering between 6% and 7% for much of 2025, monthly mortgage payments have increased significantly compared to the ultra-low rate environment of 2020–2021. A home purchased at $1.1 million with 20% down can result in monthly payments exceeding $6,000, excluding taxes, insurance, and HOA fees. In higher-end communities, total monthly housing costs can exceed $8,000. This has led to a noticeable shift in buyer behavior. Many households are increasing down payments using savings or equity from previous homes. Others are relying on dual-income structures or financial assistance from family members to qualify for loans. While this allows transactions to continue, it also increases household financial exposure. Market Behavior: Stretching for Entry Despite affordability challenges, demand in Orange County remains strong. Inventory levels remain relatively low, with months of supply often ranging between 2.5 and 3.5 months—well below a balanced market. This limited inventory continues to support high prices, even in the face of affordability concerns. However, the composition of buyers has changed. There is a growing share of “rate-sensitive” buyers who are purchasing at the upper limit of their financial capacity. Many are prioritizing location over financial flexibility, choosing to enter the market now rather than waiting for potential price adjustments. This behavior has created a market where homes are still selling, but buyers are increasingly leveraged. While default rates remain low, the financial cushion for many households has narrowed compared to previous years. The Role of Wealth Concentration Orange County’s housing market is also influenced by significant wealth concentration. High-income industries such as technology, healthcare, finance, and professional services support a strong base of cash-heavy buyers. In many luxury transactions, buyers are either making large down payments or purchasing outright without financing. This segment of the market helps stabilize prices, particularly in coastal and luxury neighborhoods. However, it also creates a two-tier market: one driven by liquidity and wealth, and another heavily dependent on financing conditions. As interest rates remain elevated, the gap between these two segments has widened. Cash buyers continue to transact with little sensitivity to rates, while financed buyers face increasing constraints. Risks of Overleveraging in the Current Cycle The concern around overleveraging does not necessarily point to an immediate market correction, but rather to increased vulnerability. When households allocate a larger portion of income toward housing costs, they become more sensitive to economic shifts such as job loss, interest rate fluctuations, or unexpected expenses. In Orange County, where many buyers are committing a significant share of income to mortgage payments, financial flexibility is more limited than in previous cycles. While foreclosure rates remain historically low, rising household debt levels suggest that some buyers are operating with reduced financial buffers. Additionally, property taxes, insurance premiums, and maintenance costs continue to rise, further increasing total housing expenses. These factors compound the strain on leveraged households. Orange County remains one of California’s most desirable and resilient real estate markets, supported by strong incomes, limited supply, and long-term demand. However, beneath this stability, financial pressure is building among a growing segment of buyers. Elevated home prices, higher interest rates, and stagnant affordability have led many households to stretch their financial capacity in order to enter the market. While this does not signal immediate instability, it does highlight a shift in buyer behavior. The market is increasingly defined by financial commitment at the upper limits of affordability rather than broad-based accessibility. Understanding this dynamic is essential for evaluating both short-term risks and long-term sustainability in Orange County’s housing landscape. Thank you for taking the time to read and reflect. I write to help people think clearly about money,
Homeownership Part 6: Your Home Is Worth Less Because of Who You Are

Imagine spending months saving for a down payment, navigating a competitive market, securing a mortgage, and finally closing on a home you are proud of. Imagine investing tens of thousands of dollars in renovations over the years, watching the neighborhood around you appreciate, and then calling an appraiser to refinance at a better rate, only to be handed a valuation that bears almost no relationship to what comparable homes in the area are actually worth. Imagine suspecting that the number is low because of your race. Imagine having that suspicion confirmed. This is not a hypothetical. It is the documented, tested, and financially quantified reality of what appraisal bias does to Black homeowners across the United States, and it is happening right now, inside a system that has yet to be fundamentally reformed. What the research actually shows The data on appraisal bias has accumulated steadily over the past several years to a point where its existence is no longer seriously disputed by credible researchers. What remains contested is the scale of its contribution to the broader devaluation of homes in Black neighborhoods, a distinction that matters for policy, but does not change the central finding that the bias is real, documented, and costly. Brookings Institution research found that homes in Black neighborhoods are valued roughly 21% to 23% below what their valuations would be in non-Black neighborhoods. Appraisal bias explains approximately 9% to 19% of that devaluation, depending on modeling approaches. Appraisal transactions in majority-Black neighborhoods are significantly more likely to be appraised under the contract price than homes in majority-white neighborhoods. At the neighborhood level, the cost of devaluation across major metro areas amounts to roughly $162 billion. That is not a rounding error in the housing market. It is a massive drain on Black wealth, accumulated over years of a system that routinely assigns lower values to the same physical structures based on who lives in them and where they are located. Even when Black Americans do own homes, their median home value sits significantly below the national median. That gap does not exist because Black homeowners are purchasing inferior properties or maintaining them less carefully. It exists because the mechanism used to establish home values has built into it a set of assumptions and practices that consistently produce lower numbers for homes in Black communities. Lower appraisals mean lower equity. Lower equity means less borrowing power, less capacity to fund home improvements, less collateral for other financial goals, and ultimately less wealth to pass on, in a country where home equity is the cornerstone of middle-class financial stability. The methodology that makes bias possible Understanding how appraisal bias works requires understanding how appraisals work. The dominant methodology in residential real estate valuation is the sales comparison approach, where an appraiser determines a home’s value primarily by comparing it to recent sales of similar properties in the same area. The approach sounds neutral, and in theory it is meant to be. In practice, it encodes historical inequities directly into current valuations. The origins of appraisal bias date back to the 1930s, when federal housing policy classified predominantly Black neighborhoods as high risk. Those classifications shaped lending access, investment patterns, and long-term property values. When comparable sales in a neighborhood reflect decades of disinvestment and depressed property values, any appraisal methodology that relies heavily on those comparables will reproduce those lower numbers in perpetuity. The bias does not need to be conscious or intentional to be structural. The system can produce racially unequal outcomes through processes that appear entirely objective on their face. An additional structural factor is the composition of the appraisal workforce itself. The profession remains overwhelmingly white, with Black appraisers representing a very small share of the field. A system this homogeneous, applying discretionary judgment in a process that directly affects the wealth of communities of color, is not well-positioned to consistently identify or correct bias. Research shows that lower appraised values for Black-owned homes persist even after controlling for a wide range of variables and individual appraiser effects. The pattern is not confined to a few actors. It is systemic. The families who proved it Some of the most compelling evidence of appraisal bias comes from homeowners who tested it directly. In multiple documented cases, families received low appraisals, removed visible indicators of race from their homes, and had a different person present the property for a second appraisal. In those instances, valuations increased significantly, in some cases by more than 40%. Other investigations have produced similar findings. Controlled testing has shown that homes associated with Black ownership are consistently valued lower than identical homes presented under white ownership conditions. These results are not statistical abstractions. They are real transactions, with real financial consequences, demonstrating how perception can directly influence valuation outcomes. A reform effort that was dismantled Federal efforts to address appraisal bias gained momentum in the early 2020s through interagency initiatives aimed at improving transparency and accountability in valuation practices. These efforts sought to standardize data collection, create mechanisms for challenging valuations, and examine structural inequities in the appraisal process. In 2025, those initiatives were effectively discontinued, halting much of the federal coordination that had been underway. The policy shift did not eliminate the underlying issue. It removed the primary federal structure tasked with studying and addressing it. In response, new legislation has been introduced to modernize appraisal practices, increase transparency in valuation data, and give homeowners a formal mechanism to appeal potentially biased appraisals. These proposals represent incremental progress, but they stop short of addressing the full structural depth of the problem. What is actually at stake It is important to be precise about what appraisal bias represents. It is not about isolated misconduct, nor is it about occasional error. It is a documented pattern in which the same property yields different valuations depending on the racial context in which it is appraised. Over time, across millions of transactions, those differences accumulate into measurable disparities in household wealth. As one
Homeownership Part 5: The 30-Point Gap That Won’t Move
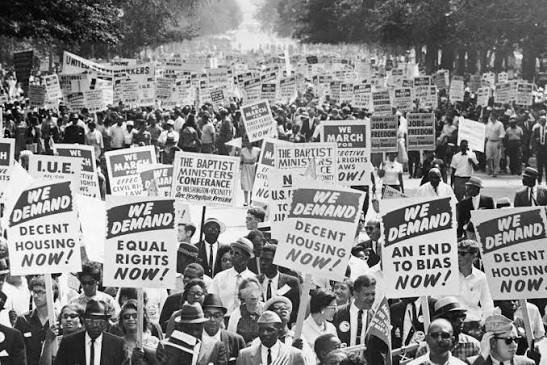
In 1968, Congress passed the Fair Housing Act. It was a landmark moment, a formal, legal declaration that discriminating against someone in the sale, rental, or financing of a home on the basis of race was no longer acceptable in the United States. After decades of codified exclusion, after redlining and restrictive covenants and a housing market built around segregation, the law drew a line and said: no more. More than fifty years later, the gap between white and Black homeownership rates is wider than it was when that law was signed. That sentence deserves to be read slowly. Not slightly larger. Not roughly equivalent. Wider. In 1968, the gap between white and Black homeownership was 27 percentage points. By 2026, that gap has grown to 28.4 points. White homeownership sits at around 71.6%, while Black homeownership stands at just 43.2%. Half a century of civil rights legislation, fair lending enforcement, community reinvestment initiatives, and targeted homeownership programs, and the needle has not just failed to close the gap, it has moved in the wrong direction. That is not a minor policy failure. It is one of the most significant and underacknowledged indictments of American housing policy in the modern era. What the numbers represent beyond percentages Numbers like these are easy to encounter and difficult to absorb. A 28-point gap in homeownership rates is not simply a statistical imbalance. It represents a compounding shortfall in wealth, stability, and opportunity that reproduces itself across generations with remarkable persistence and force. Homeownership remains the cornerstone of wealth in America, accounting for roughly 68% of total household net worth for the average family. When that pathway is obstructed, it does not just limit where one can live, it defines how one’s children will live. According to the Federal Reserve’s 2024 Survey of Consumer Finances, the median net worth of white families exceeds $285,000, compared to just $45,000 for Black families. That six-to-one wealth disparity is not explained by differences in effort, intelligence, or aspiration. It is the compounded financial residue of generations systematically denied access to the primary wealth-building vehicle that American society has made available to its citizens. The overall Black homeownership rate slipped to 43.9% in mid-2025, while the white rate hovered around 74%. Redfin chief economist Daryl Fairweather noted that Black millennials and Gen Zers are bearing the brunt of the racial homeownership gap because since they have reached homebuying age, the country has faced significant financial challenges and a major housing supply shortage. The young people who should be driving new Black homeownership growth are entering the market at a moment of maximum difficulty, high prices, elevated mortgage rates, scarce inventory, with less generational wealth to draw on and more systemic friction to navigate than their white counterparts of the same age. How the gap was built To understand why the gap persists, you have to understand how it was constructed, not as an accident or a byproduct of neutral market forces, but as the deliberate result of government policy and private practice working in coordination over several decades. Redlining is the most well-known mechanism. Starting in the 1930s, the Home Owners’ Loan Corporation systematically graded neighborhoods across the country, labeling communities with significant Black populations as “hazardous” and marking them in red on maps that banks and mortgage lenders used to determine where they would and would not extend credit. The effect was to starve entire neighborhoods of mortgage capital, making it nearly impossible for Black families to buy in those areas and equally difficult to sell, since no buyer could obtain financing. Property values in those communities stagnated, investment dried up, and infrastructure deteriorated, not because of anything the residents did, but because federal policy had made their neighborhoods financially untouchable. The GI Bill, often celebrated as one of the most transformative pieces of social legislation in American history, extended these inequities rather than correcting them. Though the bill helped white Americans prosper and accumulate wealth in the postwar years, it did not deliver on that promise for Black veterans who had served in segregated ranks. The GI Bill relied on the same redlined maps to determine where mortgages could be insured and offered. In Mississippi, a survey of 13 cities found that only 2 of the 3,229 VA loans issued in 1947 went to Black homebuyers. The largest federally subsidized wealth transfer in American history, the creation of the postwar middle class through suburban homeownership, was administered almost exclusively to white families. The long-term consequences of that exclusion are still being lived. What this created was a structural divergence that has proven extraordinarily difficult to reverse. White families who bought homes in the 1940s and 1950s, often with federal assistance, in newly constructed suburbs with good schools and appreciating property values, passed equity, security, and down payment capacity to their children and grandchildren. Black families who were denied that same access passed forward the absence of it. The gap in homeownership today is not merely a reflection of current market conditions. It is the balance sheet of a debt that has never been paid. The barriers operating right now If the historical exclusions had simply stopped without any ongoing structural disadvantages, the gap might have closed on its own over time. But the barriers to Black homeownership did not end with the Fair Housing Act. They evolved, adapted, and in some cases intensified. Mortgage denial rates remain starkly unequal. According to the National Association of Realtors’ 2025 Snapshot of Race and Home Buying, Black mortgage applicants face a denial rate of 21% and Hispanic applicants face a denial rate of 17%, compared to just 11% for white applicants and 9% for Asian applicants. These are not differences explained by creditworthiness alone. Research consistently finds that racial disparities in mortgage denial persist even after controlling for income, credit score, and loan-to-value ratio. The system is producing unequal outcomes for equal applicants, and the downstream consequences for homeownership accumulate year after year. Appraisal bias is another
Homeownership Part 4: The Insurance Crisis Nobody Is Connecting to the Housing Crisis

When people talk about what’s making homeownership unaffordable in America, the conversation almost always lands on the same handful of explanations: home prices, mortgage rates, down payments, and housing supply. Those are real problems, each worthy of serious attention. But there is another force working quietly against both aspiring and existing homeowners that rarely makes it into that conversation, one that can block a purchase before it starts, destabilize a mortgage that was already being paid faithfully, and in the worst cases, trigger the loss of a home that a family worked for years to keep. That force is the home insurance crisis. And it is far more connected to the housing affordability problem than most coverage of either subject acknowledges. A market in serious trouble The numbers describing the state of home insurance in America are striking, and they’ve moved fast. Homeowners insurance premiums rose by 64% nationwide between 2021 and 2025, nearly four times more than they did in the previous five-year period. That is not a modest adjustment to reflect changing costs. That is a fundamental repricing of what it costs to protect a home, happening in a compressed window of time that has left millions of homeowners scrambling to absorb increases they did not budget for and often cannot avoid. The premium spike is only part of the story. A recent survey of home buyers and sellers found that nearly half of respondents encountered issues with home insurance during a transaction, while 21% reported that a deal fell through entirely because of it. In states like Louisiana, 30 to 40% of mortgage loans fail because of high home insurance costs. These are not edge cases or regional anomalies. These are mainstream, widespread market failures affecting buyers and sellers across the country, deals collapsing not because of credit problems or appraisal disputes, but because the insurance required to close simply cannot be obtained at a price the transaction can bear. The mechanism connecting insurance to the purchase process is often misunderstood, but it is direct and unforgiving. While the 30-year fixed-rate mortgage has traditionally given homeowners stable and predictable payments, this stability is now being undermined. As premiums surge, mortgage payments, which in most cases include insurance through escrow, become increasingly less affordable and more unpredictable for millions of homeowners. A buyer who qualifies for a mortgage based on projected monthly costs can find themselves priced out of their own purchase when the insurance quote comes back significantly higher than anticipated. The mortgage math clears. The insurance math doesn’t. The deal dies. From pricing crisis to coverage crisis The problem has moved beyond cost alone into something harder to solve, availability. In an increasing number of markets across the country, private insurers are not simply charging more, they are leaving. Insurers facing higher risk profiles are cutting coverage, refusing renewals, or restructuring their policies in ways that shift risk onto homeowners. Those left without coverage, or forced to rely on state insurers of last resort, end up with the most to lose when a natural disaster strikes. After the devastating California wildfires, it was revealed that many of those affected had their policies canceled by their insurer only months before the disaster. The state-backed insurers of last resort that step in when private markets retreat are not a comfortable backstop. They are expensive, limited in what they cover, and were never designed to absorb the volume of policyholders now depending on them. Excess and surplus lines policies, which typically come with higher premiums and fewer consumer protections, have emerged as coverage options for properties that private insurers will no longer touch. In California, Florida, and Texas, these products accounted for roughly 16% of policies by December 2025, up from under 2% in 2023. In the span of two years, a significant portion of homeowners in three of the country’s largest states shifted from standard private coverage to a less protected, more expensive alternative, not by choice, but by necessity. The force-placed insurance trap One of the least discussed mechanisms by which insurance costs can destabilize a homeowner’s financial situation is force-placed insurance, sometimes called lender-placed insurance. Most homeowners have never heard of it until it happens to them, and by then, the financial damage has often already begun. When a homeowner’s insurance policy lapses, whether because a premium went unpaid, a policy was canceled by the insurer, or coverage was deemed insufficient, the mortgage lender is legally required to protect its financial interest in the property. The lender steps in with a force-placed insurance policy, pays the premium upfront, and then adds the cost to the borrower’s monthly mortgage payment. If the borrower cannot pay, the lender can initiate foreclosure proceedings. The homeowner does not choose this policy, does not select the insurer, and has no ability to shop for a better rate. The lender picks the company and passes the cost along. The cost involved is not comparable to standard insurance. Force-placed insurance is more expensive than a standard homeowner’s policy and can cost four to ten times more. And it provides dramatically less protection than what the homeowner previously had. Force-placed insurance covers only the loan’s remaining balance, not the actual property value. It does not cover personal property or liability claims. If a property is valued at $500,000 with a remaining mortgage balance of $15,000, the force-placed policy would likely provide only $15,000 in coverage. In other words, the homeowner pays far more for far less, a policy that protects the bank and leaves them exposed. The path from force-placed insurance to foreclosure is shorter than most people realize. A homeowner whose monthly mortgage payment suddenly increases by hundreds of dollars due to a lender-placed insurance premium, with no warning and no ability to opt out, may miss a payment. That late payment triggers additional fees and damage to credit. Many homeowners are surprised to learn that a lapsed insurance policy can trigger a costly lender-placed policy added directly to their mortgage balance,
Riverside County Real Estate: Lot Splits vs ADUs in 2026—Which Strategy Is Reshaping Housing Growth?
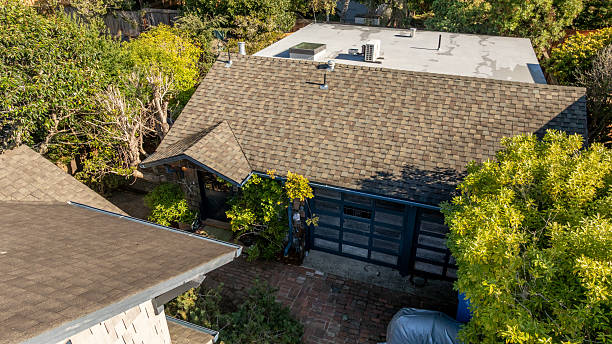
Riverside County has become one of the most closely watched real estate markets in Southern California, largely because it sits at the intersection of affordability pressure and policy-driven housing expansion. As coastal counties like Los Angeles and Orange continue to experience extreme price escalation, Riverside has absorbed a steady wave of migration from buyers seeking more attainable entry points into homeownership and investment properties. At the same time, California’s evolving housing laws are reshaping how property owners can maximize land use. Two of the most impactful tools driving this shift are SB9 lot splits and Accessory Dwelling Units (ADUs). Both strategies are designed to increase housing supply on existing residential land, but they function very differently in practice. SB9 focuses on subdividing land and creating additional primary units, while ADUs add secondary living spaces without changing the underlying parcel structure. In Riverside County, where single-family zoning still dominates but development pressure is increasing, the comparison between these two approaches has become a defining issue for homeowners, builders, and investors in 2026. Understanding how each option performs in terms of cost, approval speed, and long-term value is essential for anyone navigating this evolving market. Understanding the Two Housing Strategies SB9 Lot Splits: Creating New Parcels and Ownership Paths SB9 allows qualifying homeowners in single-family zones to split one parcel into two and build up to two units per lot, effectively creating up to four housing units in total under specific conditions. This law applies across California, including Riverside County, though local restrictions and eligibility rules still apply. To qualify, properties must meet strict criteria related to zoning, environmental risk, and land conditions. For example, parcels located in high fire zones, flood areas, or protected environmental regions may be excluded or require additional approvals. Even when eligible, SB9 developments are processed through ministerial review, meaning cities cannot require public hearings or discretionary approvals, which significantly reduces political delays. However, the process is still complex in practice. Developers must handle utility separation, new parcel mapping, and infrastructure adjustments, all of which add cost and time. In Riverside County, SB9 is often viewed as a long-term value strategy rather than a quick development solution. ADUs: Incremental Density on Existing Lots Accessory Dwelling Units (ADUs) operate under a different framework. Instead of dividing land, they add secondary housing units—either attached, detached, or converted structures—on an existing parcel. California state law requires cities and counties to allow ADUs with streamlined approvals and minimal barriers. In Riverside, homeowners can typically build at least one ADU on a residential lot, with setbacks as low as four feet and simplified permitting processes compared to traditional development. ADUs can reach up to 1,200 square feet depending on design and local compliance, and they are increasingly used for rental income, multigenerational housing, or long-term property value enhancement. Unlike SB9, ADUs do not require land subdivision, making them significantly easier and faster to implement. Cost and Feasibility Comparison in Riverside County SB9 Costs and Complexity SB9 projects tend to be capital-intensive. Costs include: Land surveying and subdivision mapping Utility separation for new parcels Infrastructure extensions (water, sewer, electrical) Construction of additional primary units In many cases, total development costs can exceed six figures before construction even begins. Additionally, financing can be more complex because lenders evaluate SB9 projects similarly to small-scale subdivisions rather than simple home improvements. The upside, however, is long-term value creation. A successful SB9 project can effectively transform a single property into two independently sellable assets, significantly increasing total property value. ADU Costs and Accessibility ADUs are generally more cost-effective and accessible. In Riverside County, basic detached ADUs often range from moderate to high five-figure or low six-figure construction budgets depending on size, materials, and utility connections. Converted garage units tend to be the most affordable entry point. Because ADUs do not require land division, permitting is faster and financing is simpler. Many homeowners use equity lines of credit or construction loans to fund projects. The return is typically generated through rental income rather than property division. Market Trends Driving Both Strategies Several key trends are influencing the growing use of both SB9 and ADUs in Riverside County: 1. Inland Migration Riverside continues to absorb demand from Los Angeles and Orange County, where median home prices often exceed $1 million. This migration increases rental demand and makes ADU construction financially attractive. 2. Affordability Pressure With interest rates remaining elevated through 2025–2026, buyers are relying more on multi-unit strategies to offset mortgage costs. ADUs are particularly popular because they generate immediate rental income. 3. State Housing Mandates California’s broader housing strategy continues to push for increased density through both subdivision (SB9) and incremental development (ADUs), ensuring both tools remain relevant in long-term planning. Key Differences in Practical Outcomes In Riverside County, the distinction between SB9 and ADUs is not just legal—it is strategic.SB9 is about ownership expansion It creates additional parcels and long-term equity growth but requires more capital and patience. ADUs are about income generation They provide faster returns through rental income and are easier to implement on most properties. In many cases, homeowners are now combining both strategies—using SB9 for long-term wealth building while adding ADUs for immediate cash flow. Riverside County sits at a critical point in California’s housing evolution. As demand continues to shift inland, property owners are increasingly looking for ways to maximize value from existing land. SB9 lot splits and ADUs represent two very different but complementary strategies that reflect this new reality. SB9 offers long-term structural transformation of property ownership, while ADUs provide immediate, flexible income opportunities. Neither approach is universally better; instead, their value depends on financial goals, property conditions, and development capacity. What is clear is that Riverside is no longer just an affordability alternative—it is becoming a laboratory for California’s new housing model, where land use, policy, and investment strategy are increasingly intertwined. Thank you for taking the time to read and reflect. I write to help people think clearly about money, business, real estate, and life — not
Homeownership Part 3: When You Own Your Home But Can’t Afford to Keep It
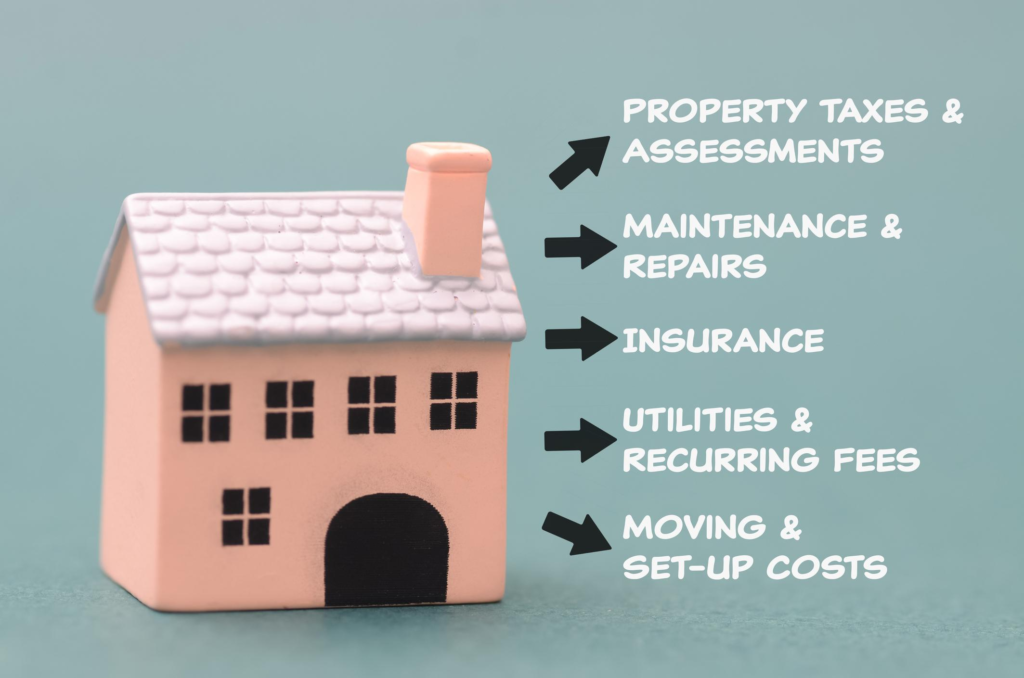
The story of homeownership in America has always been told as a story of arrival. You save, you sacrifice, you get your keys, and from that point forward you are building something, equity, stability, a foundation for your family’s future. The mortgage payment becomes the finish line. Everything after that is the reward. That framing leaves out a chapter that an increasing number of homeowners are living through right now. The chapter that comes after the closing. The one where the costs don’t stop, they just change form. Where the monthly mortgage payment, fixed and familiar, is joined by a growing roster of expenses that don’t stay fixed at all. Where people who did everything right, who bought responsibly and paid faithfully for years, find themselves financially squeezed not by a loan they couldn’t afford, but by costs they never saw coming. It is a quiet crisis happening inside what is supposed to be the ultimate financial achievement, and it is affecting tens of millions of American households. The numbers that define the problem The Harvard Joint Center for Housing Studies put the shape of this problem into clear relief in a 2025 research brief that deserves far more attention than it received. While mortgages remained the largest single housing expense for most homeowners, non-mortgage costs, home insurance, property taxes, utilities, and routine home maintenance, have increased more rapidly since the pandemic. This has raised costs and burden rates even for homeowners who have locked in historically low interest rates on their mortgages. That last detail is critical. These are not people who stretched to buy more than they could afford. These are people who bought conservatively, secured low rates, and are still struggling, because the costs surrounding the mortgage have outpaced what their incomes can absorb. The number of homeowners with cost burdens, defined as paying more than 30% of their income on housing costs, rose by 650,000 households in 2023 to a total of 20.3 million, representing 23.7% of all homeowner households. Nearly one in four homeowners in the United States is now spending more than the federally recognized threshold of affordability on the basic costs of keeping their home. And the trend is moving in the wrong direction. Median monthly owner costs for U.S. homeowners with a mortgage increased to $2,035 in 2024, up from $1,960 the year before, a 3.8% increase that outpaced the prior year’s growth rate. The hidden costs add up to a figure most prospective buyers never see in their pre-purchase calculations. According to Bankrate’s 2025 analysis, the average homeowner spends $8,808 per year on maintenance alone, nearly double the $4,494 spent on utilities and energy, double the $4,316 in annual property taxes, and four times the average $2,267 in home insurance premiums. Add those figures together and the total approaches $21,000 per year in non-mortgage costs, costs that don’t appear in the mortgage payment, don’t show up in affordability calculators, and rarely come up in conversations about whether someone can afford to buy. Nearly half of homeowners in Bankrate’s 2025 survey who expressed regret about buying cited maintenance and hidden costs as being more expensive than expected, making it the single most common source of homebuyer remorse. Who is bearing the heaviest weight The burden of rising ownership costs is not distributed evenly, and understanding who is most affected matters for how we think about solutions. Cost burdens are disproportionately faced by Black and Hispanic homeowners and are rising most rapidly for single-person and single-parent households who rely on a single income to cover housing costs. For households where one paycheck has to cover everything, the mortgage, the insurance spike, the property tax increase, the broken furnace, there is no financial buffer to absorb an unexpected cost increase. One bad year of insurance premiums or one major repair can tip a household from burdened to severely burdened, defined as spending more than 50% of income on housing. Between 2019 and 2023, 1.7 million homeowners aged 65 and over became cost-burdened, accounting for 47% of the total increase in burden nationwide. This brings the total number of burdened senior homeowners to 7.9 million, or 27.6% of all homeowners in that age group. This is a particularly acute dimension of the problem because older homeowners on fixed incomes have almost no mechanism to increase their revenue when costs rise. They cannot take on extra work. They cannot renegotiate a pension. They own their homes outright in many cases, meaning the mortgage finished decades ago, but the costs of insurance, taxes, utilities, and maintenance have grown to absorb what should have been the most financially comfortable chapter of their lives. The cost burden rate for the 11 million homeowner households earning below $30,000 per year reached 74.2% in 2023, the highest rate recorded in over 20 years, surpassing even the previous peak following the Great Recession. Three quarters of the lowest-income homeowners in America are spending more than 30% of what they earn just to stay in their homes. This is not a marginal problem or a regional curiosity. It is a widespread, worsening condition that the standard housing affordability narrative, focused almost entirely on purchase prices and mortgage rates, consistently fails to capture. The forces driving costs upward Several distinct pressures are converging to push non-mortgage ownership costs higher, and they are unlikely to reverse on their own. Insurance is perhaps the most visible. The average annual cost of home insurance rose 12% in 2025 and is projected to rise another 4% in 2026, driven in part by rising rebuilding costs and growing climate-related risks including hurricanes, floods, and wildfires. Homeowners in climate-exposed regions, coastal areas, wildfire zones, flood plains, are seeing premium increases that are not modest adjustments but structural repricing of risk. In some markets, insurers have withdrawn entirely, leaving homeowners with state-run last-resort coverage that is both more expensive and less comprehensive than private alternatives. Climate costs extend beyond insurance. A National Bureau of Economic Research study found that American
Homeownership Part 2: 62% Say Buying a Home Is Unrealistic. Who’s Paying Attention?

You need to be logged in to view this content. Please Log In. Not a Member? Join Us
HOMEOWNERSHIP PART 1: The American Dream Is Aging Out

There was a time when buying your first home was something you did in your late twenties. Maybe early thirties if life got complicated. It was one of those assumed steps, finish school, get a job, get a place. The kind of thing your parents did, and their parents before them, without too much drama about whether it was actually achievable. That timeline is gone. The median age of a first-time homebuyer in the United States has reached 40 years old, up from 33 in 2020. That’s a seven-year jump in just half a decade. To put it in historical context, the average American in 1980 became a first-time homeowner around age 29. Today’s first-time buyer is closer to a parent dropping a kid off at college than a young adult planting roots. And while that shift may look like a footnote in a quarterly housing report, what it represents is far more serious, a fundamental disruption to the way Americans have traditionally built wealth, stability, and a financial foundation for the next generation. A number that doesn’t tell the whole story on its own To be fair, there’s some debate in the research community about the exact figure. Some datasets put the median closer to 33, largely unchanged over the past decade, depending on how “first-time buyer” is defined and which survey methodology is used. But even those more conservative estimates point to the same underlying trend: first-time buyers are entering the market later, in smaller numbers, and under significantly more financial strain than they were twenty years ago. The homeownership rate for Americans 35 and under stood at 37.9% in the fourth quarter of 2025, up slightly from a five-year low of 36.3%, a modest recovery, likely tied to a brief easing in mortgage rates. But for the 35-to-44 age group, the rate sits at 60.9%, a full nine percentage points below the 25-year high of 70.1% recorded in early 2005. The direction is clear even when the exact numbers are contested. What isn’t debated is the broader affordability picture. Home prices have surged more than 50% since 2020. The minimum recommended household income to purchase a median-priced starter home hit approximately $86,000 in 2025, a threshold that exceeds the earnings of a large portion of first-time buyers. The median down payment climbed to around $30,400, representing roughly 14.4% of a home’s purchase price. For a household earning $65,000 a year and paying $1,800 a month in rent, those numbers don’t come together in a few years. They come together over a decade, if they come together at all. The weight of everything stacking at once Price is only part of the story. What’s really driving first-time buyers to the sidelines is the accumulation of financial pressures that have hit younger generations simultaneously and with unusual force. Student loan debt is one of the most significant. Many Millennials and Gen Z adults entered the workforce already carrying five- and six-figure balances before earning a meaningful paycheck. That debt doesn’t just shrink a monthly budget, it directly affects credit profiles, debt-to-income ratios, and the practical ability to qualify for a competitive mortgage. A 26-year-old with $60,000 in student debt isn’t just financially stretched. They are structurally disadvantaged in a mortgage application compared to someone who graduated without that burden, even if their income is identical. Then there’s the rental trap. In most metro markets, rents have risen fast enough that saving for a down payment while paying monthly rent has become a genuine challenge even for middle-income earners. According to survey data, 66% of renters identified saving for a down payment as the biggest barrier to homeownership, while 55% pointed to limited access to loan assistance programs, and 41% cited confusion about the mortgage process itself. These aren’t low-income renters exclusively, they’re working adults earning reasonable salaries who are still falling short of the finish line. Add to this the broader erosion of disposable income. Grocery prices, healthcare costs, childcare, and transportation have all climbed sharply over the same period that housing became less affordable. The financial slack that allowed previous generations to save aggressively in their mid-twenties simply doesn’t exist for a large portion of today’s young workforce. Survey data shows that only 36% of Americans believe they can currently afford to buy a home, down from 51% the previous year, and only 32% are actively setting money aside for a down payment. 1.82 million households that don’t exist One of the starkest ways to understand what this delay actually means is through the concept of “missing households”, adults who would, under normal market conditions, have formed independent households by now, but instead remain living with parents or in shared arrangements out of financial necessity. In 2025, an estimated 1.82 million Millennial and Gen Z households were missing, the highest count recorded in four years. Among Americans between 18 and 44, the share living with parents is 2.7 percentage points higher than it was during the 2010 to 2014 period. That’s not a rounding error. That’s a generation deferring adulthood, not because they want to, but because the market hasn’t left them much of a choice. This has real economic consequences beyond the individuals involved. Missing households mean lower demand for furniture, appliances, and home goods. They mean less neighborhood formation, fewer community anchors, and reduced civic investment. The downstream effects of a generation delayed from homeownership ripple outward in ways that don’t show up in housing market reports. The compounding cost of a late start The reason this matters beyond individual frustration is simple: homeownership has historically been the primary mechanism through which American families build and transfer wealth. The equity that accumulates in a home over 20 or 30 years is, for most middle-class households, the backbone of whatever financial stability they eventually pass on. When you buy your first home at 40 instead of 30, you’re not just ten years behind on that clock. You’re likely still managing other financial obligations, raising children, paying
Financing Barriers in San Bernardino County’s 2026 Housing Market—When Affordability Isn’t the Real Proble

San Bernardino County continues to stand out in California’s real estate landscape as one of the most affordable entry points into homeownership within Southern California. Median home prices in early 2026 remain in the range of approximately $490,000 to $550,000 depending on the city and property type, which is significantly lower than neighboring Los Angeles and Orange Counties where prices often exceed $1 million. On the surface, this gap suggests opportunity for first-time buyers and investors seeking value-driven markets. However, affordability alone does not determine accessibility. In practice, many buyers in San Bernardino are finding that the greatest challenge is not the listing price of homes, but the ability to qualify for financing under current lending conditions. Elevated interest rates, stricter underwriting standards, and rising debt-to-income expectations have created a financial environment where even moderately priced homes can be difficult to secure. As a result, the county is experiencing a shift in market behavior. Homes may be priced within reach, yet monthly payments, qualification thresholds, and lending requirements are increasingly acting as the true barriers to entry. This dynamic has reshaped how buyers approach the market in 2026, making financing—not pricing—the central issue in San Bernardino real estate. The Illusion of Affordability in a High-Rate Environment At first glance, San Bernardino County appears more accessible than much of California. Recent market data shows median home values hovering around the mid-$500,000 range, with some areas slightly lower depending on condition and location. Compared to coastal counties, this pricing structure should theoretically support strong first-time buyer activity. However, the affordability equation changes significantly when interest rates are factored in. With 30-year fixed mortgage rates remaining elevated in the 6% to 7% range throughout 2025 and into 2026, monthly payment obligations have increased substantially compared to the previous low-rate cycle. A $500,000 home purchased with a standard 20% down payment can result in monthly mortgage payments exceeding $3,200 to $3,800 once taxes and insurance are included. For many households, this pushes total housing costs well beyond comfortable debt-to-income ratios. This creates a situation where homes are technically affordable in price, but not in monthly payment structure. Debt-to-Income Ratios: The Real Gatekeeper Lenders in 2026 continue to rely heavily on debt-to-income (DTI) ratios to determine borrower eligibility. While conventional lending guidelines often target a DTI ceiling around 43%, many borrowers in San Bernardino are approaching or exceeding this threshold due to existing consumer debt and rising living expenses. What makes this particularly important in the Inland Empire is the income-to-cost imbalance. While home prices are lower than coastal markets, median household incomes have not increased at the same pace as borrowing costs. This creates a squeeze where even modest mortgage payments consume a larger share of monthly income than in previous cycles. In practical terms, two households with identical income profiles may see very different outcomes depending on existing credit card debt, auto loans, and student loan obligations. This makes mortgage approval less predictable and more sensitive to financial structure rather than just income level. Credit Standards and Lending Tightening Another major factor shaping San Bernardino’s housing market is the tightening of credit standards. While lending is not historically restrictive, banks have become more cautious in response to interest rate volatility and broader economic uncertainty. Borrowers with credit scores below the mid-700s are increasingly facing higher interest rate adjustments, stricter reserve requirements, or in some cases, loan denial despite having sufficient income on paper. This creates a tiered buyer pool where financially stronger applicants are able to move forward, while middle-tier borrowers are often pushed out of the market. The result is a narrowing of the qualified buyer base, even in a region traditionally known for accessibility. The Impact on Market Activity San Bernardino’s housing market reflects these financing constraints in several measurable ways. Homes are still selling, but transaction volume is uneven and highly sensitive to rate changes. Recent data shows that homes can remain on the market for extended periods when priced even slightly above buyer qualification thresholds. In many cases, sellers are adjusting prices multiple times before securing offers, particularly in older housing stock or properties requiring repairs. Cash buyers and investor groups have become more prominent in this environment, as they are less dependent on traditional financing structures. At the same time, rental demand remains relatively strong. Monthly rents averaging around the mid-$2,000 range have created an alternative pressure point, where some households opt to rent longer rather than commit to high monthly mortgage obligations under current lending conditions. First-Time Buyers and the Qualification Gap First-time buyers are the most affected segment in San Bernardino County’s current market. Many households can afford down payments or meet basic price expectations, but fall short when evaluated under full underwriting standards. This “qualification gap” is driven by several factors: High existing consumer debt obligations Limited savings for reserves required by lenders Interest rate sensitivity increasing monthly payment burdens Stricter documentation requirements for self-employed borrowers As a result, many potential buyers remain in a holding pattern, waiting for either rate relief or income growth before entering the market. Investor Activity and Market Adaptation While owner-occupant buyers face challenges, investor activity continues to play a stabilizing role in San Bernardino’s housing market. Cash-heavy investors are often better positioned to acquire properties quickly, particularly those needing renovation or repositioning. This has created a bifurcated market structure where traditional buyers face financing constraints, while investors operate with greater flexibility. Over time, this dynamic can influence neighborhood composition, rental supply, and long-term pricing stability. San Bernardino County’s 2026 housing market demonstrates a critical shift in how affordability is defined. While home prices remain comparatively accessible within Southern California, financing conditions have become the primary barrier to entry. Rising interest rates, stricter lending standards, and higher debt-to-income expectations have redefined what it means to “qualify” for a home. The result is a market where opportunity exists on paper, but access is determined by financial structure rather than price alone. For buyers, this means preparation and financial positioning are
Mortgage Delinquencies Are Low—but the Warning Signal Is Underneath the Headline
You need to be logged in to view this content. Please Log In. Not a Member? Join Us